Posted in Uncategorized | Leave a Comment »
Posted in Uncategorized | Leave a Comment »
Posted in Uncategorized | Leave a Comment »
surface-deformation-script-multiple-vector-fields
surface-deformation-script-multiple-objects
These two scripts are really just minor alterations to the previous Surface Deformation Script I posted earlier. The first one allows the user to use two vector fields to affect the upper and lower halves of a surface differently. The second script allows the user to select multiple meshes to deform at one time.
Posted in Uncategorized | Leave a Comment »
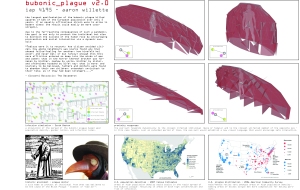
This is one of two 42×15 inch panels. I have the extinction timeline running across the top to introduce my crisis. On the left are the four primary data maps that I used for research. In the middle, I list the primary cause of my crisis, the hypothesis I’m working with and the architectural response I chose to move forward with. I’ll briefly go over this in my presentation to set up the scripting exercises I’ve been working on. On the right are the prelimary sketches I drew as a working model for how the scripting forms would manifest themselves. Now, I’m working on the second panel which show all the scripted forms I developed… Still a lot to work on, but it’s coming along. I’ll post the second panel soon.

Posted in Uncategorized | Leave a Comment »
Guys, Skylar just gave me this clue. I often got an error message when doing loop using UV coordinate on the surfaces. Apparently, I thought that the name of the point (arrPt(m,n)) is the actual position of the UV coordinate, which is NOT. Its only labeling the array that contain X,Y,Z point. To move the actual coordinate you need to modify the value of each X,Y,Z on the array.
Hope it helps. [ ’cause sometimes the error is not lies on the line that pointed out by the error message ]
Posted in Uncategorized | Leave a Comment »
Posted in Uncategorized | Leave a Comment »
This script will deform any surface based on a supplied vector field (a series of curves created by the user). The script can be modified to deform a mesh instead of a surface by altering the geometry type of the “strObject” variable. The script requires the user to create a surface and a vector field to perform the operation.
Posted in Uncategorized | Leave a Comment »
draft layout (w/ dummy text).

Posted in Uncategorized | Leave a Comment »
Option Explicit
‘Script written by <Masoud Akbarzadeh>
‘Script copyrighted by <MIT Deoartment of Architecture>
‘Script version Tuesday, January 13, 2009 4:45:31 PM
Call tensegrity()
Sub tensegrity()
Dim i,j,m,n,k
Dim arrpt(200,200), toppt(200,200), toppt2(200,200), arrintsctE(200,200), arrintsctF(200,200)
Dim arrparam(1), normvec
Dim strobj
strobj=Rhino.getobject (“select the object”, 8)
Dim x : x=Rhino.Getinteger (“enter the number of iterations in U”, 10,,200)
Dim y : y=Rhino.GetInteger (“enter the number of iterations in V”,10,,200)
x=x-1
y=y-1
Rhino.EnableRedraw (False)
Dim normvecE,normvecF, veccross, vecunit, vecunit2
Dim u
u=Rhino.surfacedomain (strobj,0)
Dim v
v=Rhino.surfacedomain (strobj,1)
‘loop through u and V to get x and y
For i=0 To x
arrparam(0) = u(0) + (((u(1) – u(0)) / x) * i)
For j=0 To y
arrparam(1) = v(0) + (((v(1) – v(0))/y)*j)
arrpt(i,j)=Rhino.evaluatesurface(strobj,arrparam)
normvec=rhino.SurfaceNormal(strobj,arrparam)
If Isarray (normvec) Then
‘rhino.Print”yey”
‘End If
normvec=rhino.VectorUnitize(normvec)
‘normvec=vectorscale(normvec,3)
toppt(i,j)=rhino.pointadd(arrpt(i,j),normvec)
‘addpoint arrpt(i,j)
‘addpoint toppt(i,j)
End If
Next
Next
Dim e,f,planeE,planeF, circleE, circleF
For e=1 To x
For f=1 To y
If (e=x) Or (f=y) Then
Call trussmemberH1(arrpt(e,f),arrpt(e-1,f),.01)
Call trussmemberH2(arrpt(e,f),arrpt(e,f-1),.01)
Call trussmemberH1(toppt(e,f),toppt(e-1,f),.01)
Call trussmemberH2(toppt(e,f),toppt(e,f-1),.01)
Call trussmemberN(arrpt(e,f),arrpt(e-1,f),arrpt(e,f-1), toppt(e,f),.01)
addpoint toppt(e,f)
End If
Next
Next
For e=0 To x-1
For f=0 To y-1
Call trussmemberH2(arrpt(e,f),arrpt(e,f+1),.01)
Call trussmemberH1(arrpt(e,f),arrpt(e+1,f),.01)
Call trussmemberH2(toppt(e,f),toppt(e,f+1),.01)
Call trussmemberH1(toppt(e,f),toppt(e+1,f),.01)
Call trussmemberN(arrpt(e,f),arrpt(e+1,f),arrpt(e,f+1), toppt(e,f),.01)
‘rhino.addpoint toppt(e,f)
Next
Next
For e=0 To x
For f=0 To y
If (e=0 And f=y) Or (f=0 And e=x) Then
Call trussmemberE(arrpt(e,f),normvec,toppt(e,f),.01)
End If
Next
Next
For e=1 To x Step 2
For f=1 To y Step 2
If ((e=x) Or (f=y)) Then
Call trussmemberH1(arrpt(e,f),toppt(e-1,f),.05)
Call trussmemberH1(arrpt(e-1,f-1),toppt(e,f-1),.05)
Call trussmemberH2(toppt(e,f),arrpt(e,f-1),.05)
End If
Next
Next
For e=0 To x-1 Step 2
For f=0 To y-1 Step 2
If (e<>x-1 And f<>y-1) Then
Call trussmemberH1(arrpt(e,f),toppt(e+1,f),.05)
Call trussmemberH1(toppt(e+1,f),arrpt(e+2,f),.05)
Call trussmemberH1(toppt(e,f+1),arrpt(e+1,f+1),.05)
Call trussmemberH1(arrpt(e+1,f+1),toppt(e+2,f+1),.05)
Call trussmemberH2(arrpt(e+1,f),toppt(e+1,f+1),.05)
Call trussmemberH2(toppt(e+1,f+1),arrpt(e+1,f+2),.05)
Call trussmemberH1(toppt(e,f),arrpt(e,f+1),.05)
Call trussmemberH2(arrpt(e,f+1),toppt(e,f+2),.05)
End If
Next
Next
Rhino.EnableRedraw (True)
End Sub
Function trussmemberH1(arrpt1, arrpt2,dblint)
Dim normvec,planeframe, arrcirc
normvec=rhino.VectorCreate(arrpt1,arrpt2)
planeframe=planefromnormal(arrpt1,normvec)
arrcirc=rhino.addcircle(planeframe,dblint)
trussmemberH1=rhino.extrudecurvestraight(arrcirc,arrpt1,arrpt2)
End Function
Function trussmemberH2(arrpt1, arrpt2,dblint)
Dim normvec,planeframe, arrcirc
normvec=rhino.VectorCreate(arrpt1,arrpt2)
planeframe=planefromnormal(arrpt1,normvec)
arrcirc=rhino.addcircle(planeframe,dblint)
trussmemberH2=rhino.extrudecurvestraight(arrcirc,arrpt1,arrpt2)
End Function
Function trussmemberN(arrpt1, arrpt2, arrpt3, arrpt4, dblint)
Dim veccross, vecH1, vecH2, vecunit,planeframe, arrcirc
vecH1=rhino.Vectorcreate(arrpt1, arrpt2)
vecH2=rhino.vectorcreate(arrpt1, arrpt3)
veccross=rhino.vectorcrossproduct(vecH1,vecH2)
vecunit=vectorunitize(veccross)
planeframe=planefromnormal(arrpt1,vecunit)
arrcirc=rhino.addcircle(planeframe,dblint)
trussmemberN=rhino.extrudecurvestraight(arrcirc, arrpt1, arrpt4)
End Function
Function trussmemberE(arrpt, normvec, arrpt2,dblint)
Dim arrcirc
arrcirc=addcircle(planefromnormal(arrpt, normvec),dblint)
trussmemberE=rhino.extrudecurvestraight(arrcirc,arrpt,arrpt2)
End Function
Posted in Uncategorized | Leave a Comment »
Since I won’t make it today today’s session, I thought I’d post my progress so far..
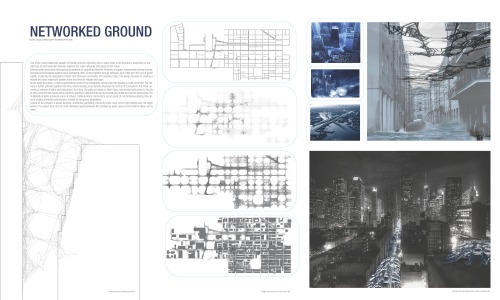
I’m working on laying out the original sketches onto a panel for the final presentation. Here’s the dissolving grid I set up for the first sketch as well as cross sections taking from the base to the top.


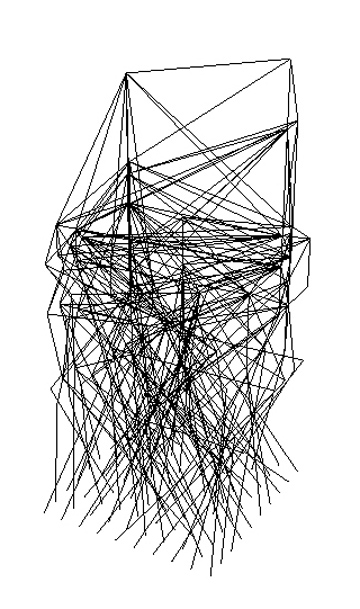
These are similar to the first sketch but the grid was simplified and the curves abstracted.

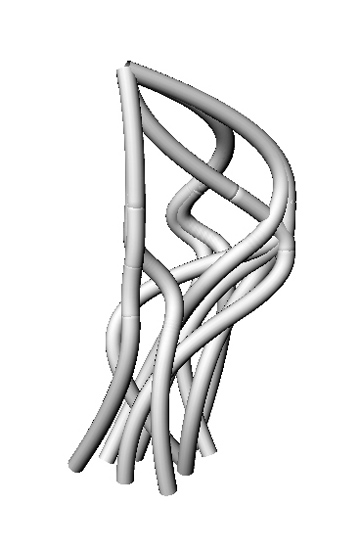
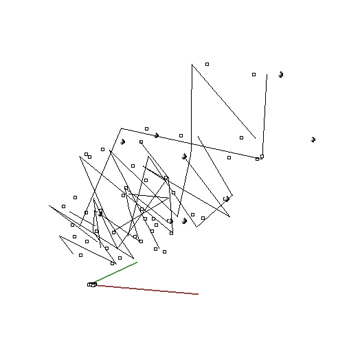
I’m also working on playing with the code variations to see how i can manipulate the form. So far, I’ve been able to change the direction of the form and shift its scale. Pretty simple, but still a minor success to see changes happening. These examples represent 1) no manipulations, 2) increasing values, 3) Rnd function, and 4) Rnd function + increasing values. I realized afterward that I wasn’t matching the values to the sphere shapes so these aren’t lining up correctly. I’m working on that now…


Posted in Uncategorized | Leave a Comment »
Finally got the simulation script done and working properly. Here’s a link to a zip containing both the working script and the file I’ve been running it on. The whole thing takes approximately 5-10 minutes to run through from start to finish. I tried making a plan of a smaller area of Southie to limit the number of calculations but when I tried the script wouldn’t work, so I’ve just stuck with the larger plan.
Next step is to develop something to use as the suit/environment and start to script how that will be modified by the info coming out of the simulation script.
Posted in Uncategorized | Leave a Comment »
We are adding an extra session this Thursday from 2 – 6pm.
Please save your now-working scripts in .txt format and upload it onto the blog so that others can access and learn.
For Friday prepare a mock-up A0 panel that explains graphically and systematically the initial data, your control mechanisms, and their outcomes. There should also be proxy images of your design.
***Please save your scripts as a .doc file by pasting it into notepad or microsoft word and saving it. Then upload the .doc file to your post and in the media library click “post url” instead of “insert into post”. This will add a link to the post so that everyone can download your file.
Posted in Uncategorized | Leave a Comment »
Option Explicit
Call Main()
Sub Main()
Dim arrPoints
arrPoints = rhino.getObjects(“select all points to draw a curve “)
drawCurveForEveryPoints(arrPoints)
End Sub
Function drawCurveForEveryPoints(arrPoints)
Dim point1, point2
Dim point1CD, point2CD
Dim arrPtForCurve
Dim max : max = Ubound(arrPoints)
rhino.print max
Dim i,j
For i = 0 To max
point1CD = Rhino.PointCoordinates (arrPoints(i))
For j = i+1 To max
point2CD = Rhino.PointCoordinates (arrPoints(j))
arrPtForCurve = array(point1CD, point2CD)
rhino.addcurve arrPtForCurve
Next
Next
End Function
Posted in Uncategorized | Leave a Comment »
Option Explicit
‘excel import to rhinoscript , che-wei wang 4.8.2008
‘excel cell numbers begin with 1,1 (not 0,0)
Call Main()
Sub Main()
Dim FileName, file, excel
FileName = Rhino.OpenFileName(“Select Excel File”,”Excel Files (*.xls)|*.xls||”)
If isNull(FileName) Then Exit Sub
Set excel = CreateObject(“Excel.Application”)
excel.Visible = True
excel.Workbooks.Open(FileName)
Set file = excel.ActiveSheet
Dim i
Dim value(2)
Dim arrPoints(99) ‘array is zero based
For i = 1 To 100
value(0) = file.Cells(i,1).Value ‘excel file is not zero based
value(1) = file.Cells(i,2).Value
value(2) = file.Cells(i,3).Value
arrPoints(i-1) = rhino.addPoint (value)
Next
Dim arrPoint1, arrPoint2, arrPoint3
Dim strPoint1, strPoint2
For Each strPoint1 In arrPoints
arrPoint1 = rhino.PointCoordinates(strPoint1)
For Each strPoint2 In arrPoints
arrPoint2 = rhino.PointCoordinates(strPoint2)
arrPoint3 = array(arrPoint1, arrPoint2)
rhino.AddCurve arrPoint3
Next
Next
excel.UserControl = True
End Sub
Posted in Uncategorized | Leave a Comment »
Option Explicit
‘Script written by <Ayodh Kamath>
‘Script copyrighted by <4.195 Command & Control>
‘Script version Saturday, January 17, 2009 11:02:46 AM
Call Main()
Sub Main()
Dim arrAllPts()
Dim arrPerimPts()
Dim arrAllLines()
Dim realLine1, realLine2, realLine3, realLine4, realLine5, realLine6
Dim intI
Dim strCircumCirc
Dim intChoice
‘drawing the first triangle
realLine1 = Rhino.GetReal(“Give length of 1st member”)
realLine2 = Rhino.GetReal(“Give length of 2nd member”)
realLine3 = Rhino.GetReal(“Give length of 3rd member”)
ReDim Preserve arrAllPts(0) : arrAllPts(0) = Array(0,1,0)
ReDim Preserve arrAllPts(1) : arrAllPts(1) = Array(realLine1,1,0)
ReDim Preserve arrAllLines(0) : arrAllLines(0) = Rhino.AddLine(arrAllPts(0), arrAllPts(1))
ReDim Preserve arrAllPts(2) : arrAllPts(2) = twoPtTriangle (arrAllLines(0), realLine2, realLine3, Array(0,0,0))
ReDim Preserve arrAllLines(1) : arrAllLines(1) = Rhino.AddLine(arrAllPts(0), arrAllPts(2))
ReDim Preserve arrAllLines(2) : arrAllLines(2) = Rhino.AddLine(arrAllPts(1), arrAllPts(2))
Rhino.AddPoints arrAllPts
intChoice = Rhino.GetInteger(“Create tetrahedron? (Y=1, N=2)”)
While intChoice = 1
Call tetrahedron
intChoice = Rhino.GetInteger(“Create tetrahedron? (Y=1, N=2)”)
Wend
End Sub
Function twoPtTriangle(strLine, realLength1, realLength2, arrDirPt)
Dim arrCircPlane
Dim arrOrigin
Dim arrX
Dim strCirc1, strCirc2
Dim arrIntPts
Dim strIntPt1, strIntPt2
Dim arrIntPt1, arrIntPt2
Dim realDist1, realDist2
arrOrigin = Rhino.CurveStartPoint(strLine)
arrX = Rhino.CurveEndPoint(strLine)
arrCircPlane = Rhino.PlaneFromPoints(arrOrigin, arrX, arrDirPt)
strCirc1 = Rhino.AddCircle(arrCircPlane, realLength1)
arrOrigin = Rhino.CurveEndPoint(strLine)
arrX = Rhino.CurveStartPoint(strLine)
arrCircPlane = Rhino.PlaneFromPoints(arrOrigin, arrX, arrDirPt)
strCirc2 = Rhino.AddCircle(arrCircPlane, realLength2)
arrIntPts = Rhino.CurveCurveIntersection(strCirc1, strCirc2)
strIntPt1 = rhino.AddPoint (arrIntPts(0,1))
strIntPt2 = rhino.AddPoint (arrIntPts(1,1))
arrIntPt1 = Rhino.PointCoordinates(strIntPt1)
arrIntPt2 = Rhino.PointCoordinates(strIntPt2)
realDist1 = Rhino.Distance(arrIntPt1, Array(0,0,0))
realDist2 = Rhino.Distance(arrIntPt2, arrDirPt)
If (realDist1 > realDist2) Then
twoPtTriangle = arrIntPt2
Else
twoPtTriangle = arrIntPt1
End If
Rhino.DeleteObject strIntPt1
Rhino.DeleteObject strIntPt2
Rhino.DeleteObject strCirc1
Rhino.DeleteObject strCirc2
End Function
Function tetrahedron
Dim arrTetPts
Dim arrTetLines()
Dim realLength1, realLength2, realLength3
Dim strSphere1, strSphere2, strSphere3
Dim arrIntersect1, arrIntersect2, arrCurveIntersect
Dim strIntersectTempCurve(1), arrIntersectJoinCurve, strIntersectCurve1, strIntersectCurve2, strIntersectPt1, strIntersectPt2, strIntersectPt
Dim arrOpPt
arrTetPts = Rhino.GetPointCoordinates (“Select points:”)
‘drawing the tetrahedron
realLength1 = Rhino.GetReal(“Give length of 1st member”)
realLength2 = Rhino.GetReal(“Give length of 2nd member”)
realLength3 = Rhino.GetReal(“Give length of 3rd member”)
strSphere1 = Rhino.AddSphere(arrTetPts(0), realLength1)
strSphere2 = Rhino.AddSphere(arrTetPts(1), realLength2)
arrIntersect1 = Rhino.SurfaceSurfaceIntersection(strSphere1, strSphere2,,True)
strIntersectTempCurve(0) = arrIntersect1(0,1)
If (Ubound(arrIntersect1,1)) > 0 Then
strIntersectTempCurve(1) = arrIntersect1(1,1)
arrIntersectJoinCurve = Rhino.JoinCurves(strIntersectTempCurve)
strIntersectCurve1 = arrIntersectJoinCurve(0)
Else
strIntersectCurve1 = arrIntersect1(0,1)
End If
strSphere3 = Rhino.AddSphere(arrTetPts(2), realLength3)
arrIntersect2 = Rhino.SurfaceSurfaceIntersection(strSphere1, strSphere3,,True)
strIntersectTempCurve(0) = arrIntersect2(0,1)
If (Ubound(arrIntersect2,1)) > 0 Then
strIntersectTempCurve(1) = arrIntersect2(1,1)
arrIntersectJoinCurve = Rhino.JoinCurves(strIntersectTempCurve)
strIntersectCurve2 = arrIntersectJoinCurve(0)
Else
strIntersectCurve2 = arrIntersect2(0,1)
End If
arrCurveIntersect = Rhino.CurveCurveIntersection(strIntersectCurve1, strIntersectCurve2)
strIntersectPt1 = Rhino.AddPoint(arrCurveIntersect(0,1))
strIntersectPt2 = Rhino.AddPoint(arrCurveIntersect(1,1))
arrOpPt = Rhino.GetPointCoordinates(“Select opposite point:”)
If (Rhino.Distance(arrOpPt, arrCurveIntersect(0,1))) < (Rhino.Distance(arrOpPt, arrCurveIntersect(1,1))) Then
strIntersectPt = strIntersectPt2
Rhino.DeleteObject strIntersectPt1
Else
strIntersectPt = strIntersectPt1
Rhino.DeleteObject strIntersectPt2
End If
ReDim Preserve arrTetPts(3) : arrTetPts(3) = arrCurveIntersect(0,1)
ReDim Preserve arrTetLines(3) : arrTetLines(3) = Rhino.AddLine(arrTetPts(0), arrTetPts(3))
ReDim Preserve arrTetLines(4) : arrTetLines(4) = Rhino.AddLine(arrTetPts(1), arrTetPts(3))
ReDim Preserve arrTetLines(5) : arrTetLines(5) = Rhino.AddLine(arrTetPts(2), arrTetPts(3))
Rhino.DeleteObject strSphere1
Rhino.DeleteObject strSphere2
Rhino.DeleteObject strSphere3
Rhino.DeleteObject strIntersectCurve1
Rhino.DeleteObject strIntersectCurve2
End Function

Posted in Uncategorized | Leave a Comment »
Option Explicit
‘Script written by <insert name>
‘Script copyrighted by <insert company name>
‘Script version Friday, January 16, 2009 5:35:39 PM
‘Call Main()
Sub Main()
Dim x,y,p,q
Dim k : k = 0
Dim arrpt(8)
Dim arrGDP : arrGDP = Array(1,2,3,4,5,6,7,8,9)
Dim arrSp : arrSp = Array(5,4,3,2,1,9,8,7,6)
Dim arrPtCord
Dim lowest, strLyr, arrPtNew
strLyr = Rhino.AddLayer (“Died”)
Dim arrCoordMv(8,10)
‘Create Points and Assign Name
For x = 0 To 2
For y = 0 To 2
arrPt(k) = Rhino.AddPoint (Array(x,y,0))
Rhino.ObjectName arrpt(x), arrGDP(x) & ” : ” & arrSP(x)
k = k + 1
Next
Next
For p = 0 To 10 ‘weeks
For q = 0 To Ubound(arrPt) ‘Move randomly every week
arrPtCord = Rhino.PointCoordinates (arrPt(q))
Rhino.MoveObject arrPt(q), arrPtCord,
Array(arrPtCord(1)+(Rnd*arrGDP(q)),arrPtCord(2)+(Rnd*arrSp(q)),
arrPtCord(0)+(Rnd*(arrGDP(q)+arrSP(q))))
arrCoordMv(q,p) =
Array(arrPtCord(0)+(Rnd*arrSp(q)),arrPtCord(1)+(Rnd*arrGDP(q)),
arrPtCord(2)+(Rnd*(arrGDP(q)+arrSP(q))))
‘Rhino.AddLine arrPtCord,
Array(arrPtCord(0)+(Rnd*arrGDP(q)),arrPtCord(1)+(Rnd*arrSp(q)),
arrPtCord(2)+(Rnd*(arrGDP(q)+arrSP(q))))
Next
lowest = findLowest(arrGDP,arrSP)
Rhino.ObjectLayer arrPt(lowest), (“Died”)
Next
‘Change the highest value to include the lowest value
‘Add curves here
Rhino.addPolyline Array(arrCoordMv(0,0),
arrCoordMv(0,1),arrCoordMv(0,2), arrCoordMv(0,3), arrCoordMv(0,4),
arrCoordMv(0,5), arrCoordMv(0,4),arrCoordMv(0,5), arrCoordMv(0,6),
arrCoordMv(0,7), arrCoordMv(0,8), arrCoordMv(0,9), arrCoordMv(0,10))
Rhino.addPolyline Array(arrCoordMv(1,0),
arrCoordMv(1,1),arrCoordMv(1,2), arrCoordMv(1,3), arrCoordMv(1,4),
arrCoordMv(1,5), arrCoordMv(1,4),arrCoordMv(1,5), arrCoordMv(1,6),
arrCoordMv(1,7), arrCoordMv(1,8), arrCoordMv(1,9), arrCoordMv(1,10))
Rhino.addPolyline Array(arrCoordMv(2,0),
arrCoordMv(2,1),arrCoordMv(2,2), arrCoordMv(2,3), arrCoordMv(2,4),
arrCoordMv(2,5), arrCoordMv(2,4),arrCoordMv(2,5), arrCoordMv(2,6),
arrCoordMv(2,7), arrCoordMv(2,8), arrCoordMv(2,9), arrCoordMv(2,10))
Rhino.addPolyline Array(arrCoordMv(3,0),
arrCoordMv(3,1),arrCoordMv(3,2), arrCoordMv(3,3), arrCoordMv(3,4),
arrCoordMv(3,5), arrCoordMv(3,4),arrCoordMv(3,5), arrCoordMv(3,6),
arrCoordMv(3,7), arrCoordMv(3,8), arrCoordMv(3,9), arrCoordMv(3,10))
Rhino.addPolyline Array(arrCoordMv(4,0),
arrCoordMv(4,1),arrCoordMv(4,2), arrCoordMv(4,3), arrCoordMv(4,4),
arrCoordMv(4,5), arrCoordMv(4,4),arrCoordMv(4,5), arrCoordMv(4,6),
arrCoordMv(4,7), arrCoordMv(4,8), arrCoordMv(4,9), arrCoordMv(4,10))
Rhino.addPolyline Array(arrCoordMv(5,0),
arrCoordMv(5,1),arrCoordMv(5,2), arrCoordMv(5,3), arrCoordMv(5,4),
arrCoordMv(5,5), arrCoordMv(5,4),arrCoordMv(5,5), arrCoordMv(5,6),
arrCoordMv(5,7), arrCoordMv(5,8), arrCoordMv(5,9), arrCoordMv(5,10))
Rhino.addPolyline Array(arrCoordMv(6,0),
arrCoordMv(6,1),arrCoordMv(6,2), arrCoordMv(6,3), arrCoordMv(6,4),
arrCoordMv(6,5), arrCoordMv(6,4),arrCoordMv(6,5), arrCoordMv(6,6),
arrCoordMv(6,7), arrCoordMv(6,8), arrCoordMv(6,9), arrCoordMv(6,10))
Rhino.addPolyline Array(arrCoordMv(7,0),
arrCoordMv(7,1),arrCoordMv(7,2), arrCoordMv(7,3), arrCoordMv(7,4),
arrCoordMv(7,5), arrCoordMv(7,4),arrCoordMv(7,5), arrCoordMv(7,6),
arrCoordMv(7,7), arrCoordMv(7,8), arrCoordMv(7,9), arrCoordMv(7,10))
Rhino.addPolyline Array(arrCoordMv(8,0),
arrCoordMv(8,1),arrCoordMv(8,2), arrCoordMv(8,3), arrCoordMv(8,4),
arrCoordMv(8,5), arrCoordMv(8,4),arrCoordMv(8,5), arrCoordMv(8,6),
arrCoordMv(8,7), arrCoordMv(8,8), arrCoordMv(8,9), arrCoordMv(8,10))
End Sub
Function findLowest (arrG,arrS)
Dim low : low = 100000000000
Dim calc
Dim x
Dim y : y = 0
For x = 0 To Ubound(arrG)
calc = arrG(x) + arrS(x)
If calc <= low Then
low = calc
y = x
End If
Next
findLowest = y
End Function
Call FlatWorm()
Sub FlatWorm()
Dim crvObject : crvObject = Rhino.GetObject(“Pick a backbone curve”,
4, True, False)
If IsNull(crvObject) Then Exit Sub
Dim intSamples : intSamples = Rhino.GetInteger(“Number of cross
sections”, 100, 5)
If IsNull(intSamples) Then Exit Sub
Dim dblBendRadius : dblBendRadius = Rhino.GetReal(“Bend plane
radius”, 1, 0.001)
If IsNull(dblBendRadius) Then Exit Sub
Dim dblPerpRadius : dblPerpRadius = Rhino.GetReal(“Ribbon plane
radius”, 1, 0.001)
If IsNull(dblPerpRadius) Then Exit Sub
Dim crvDomain : crvDomain = Rhino.CurveDomain(crvObject)
Dim t, N
Dim arrCrossSections(), CrossSectionPlane
Dim crvCurvature, crvPoint, crvTangent, crvPerp, crvNormal
N = -1
For t = crvDomain(0) To crvDomain(1) + 1e-9 Step
(crvDomain(1)-crvDomain(0))/intSamples
N = N+1
crvCurvature = Rhino.CurveCurvature(crvObject, t)
If IsNull(crvCurvature) Then
crvPoint = Rhino.EvaluateCurve(crvObject, t)
crvTangent = Rhino.CurveTangent(crvObject, t)
crvPerp = Array(0,0,1)
crvNormal = Rhino.VectorCrossProduct(crvTangent, crvPerp)
Else
crvPoint = crvCurvature(0)
crvTangent = crvCurvature(1)
crvPerp = Rhino.VectorUnitize(crvCurvature(4))
crvNormal = Rhino.VectorCrossProduct(crvTangent, crvPerp)
End If
CrossSectionPlane = Rhino.PlaneFromFrame(crvPoint, crvPerp, crvNormal)
ReDim Preserve arrCrossSections(N)
arrCrossSections(N) = Rhino.AddEllipse(CrossSectionPlane,
dblBendRadius, dblPerpRadius)
Next
If N < 1 Then Exit Sub
Call Rhino.AddLoftSrf(arrCrossSections)
Call Rhino.DeleteObjects(arrCrossSections)
End Sub
Posted in Uncategorized | Leave a Comment »
Here’s a few iterations I pulled from the code I’m working with. I’m having some problems controlling the direction of the movement, but made some changes on the multipliers to extend the reach of some of the lines. Also, I added a tunnel code, but it requires I choose the polylines individually…


Posted in Uncategorized | Leave a Comment »
Now that everyone has a working script, make a catalogue with incremental differences. Define what design criteria are being addressed in your iterations – diagram these relationships to make them subject to evaluation.
For example, what vector field is useful in the manipulation of a set of control points? What input and output are selected, what is being controlled? Scale, modularity, representation should be addressed.
Posted in Uncategorized | Leave a Comment »
 Option Explicit
‘Script written by <Masoud Akbarzadeh>
‘Script copyrighted by <MIT Deoartment of Architecture>
‘Script version Tuesday, January 13, 2009 4:45:31 PM
Call spaceframeV()
Sub spaceframeV()
Dim i,j,m,n,k
Dim arrpt(200,200), toppt(200,200), toppt2(200,200)
Dim arrparam(1)
Dim strobj
Dim arrcircV(200,200), arrcircV2(200,200),arrcircH(200,200),arrcircH2(200,200), arrcircHV(200,200), arrcircHV2(200,200)
Dim crosssectionsV(200,200), arrcrossHV(200,200)
Dim crosssectionsH(),crosssectionsH2(),crosssectionsHV(), crosssectionsHV2()
strobj=Rhino.getobject (“select the object”, 8)
Dim x : x=Rhino.Getinteger (“enter the number”, 10,,200)
Dim y : y=Rhino.GetInteger (“enter the number”,10,,200)
x=x-1
y=y-1
Rhino.EnableRedraw (False)
Dim u
u=Rhino.surfacedomain (strobj,0)
Dim v
v=Rhino.surfacedomain (strobj,1)
‘loop through u and V to get x and y
For i=0 To x
arrparam(0) = u(0) + (((u(1) – u(0)) / x) * i)
For j=0 To y
arrparam(1) = v(0) + (((v(1) – v(0))/y)*j)
arrpt(i,j)=Rhino.evaluatesurface(strobj,arrparam)
Next
Next
Dim normvecE,normvecF, veccross
Dim e,f
For e=0 To x-1
For f=0 To y-1
normvecE=rhino.vectorcreate(arrpt(e,f),arrpt(e+1,f))
normvecF=rhino.VectorCreate(arrpt(e,f),arrpt(e,f+1))
veccross=rhino.VectorCrossProduct(normvecE,normvecF)
veccrossunit=rhino.VectorUnitize(veccross)
toppt(e,f)=rhino.PointAdd(arrpt(e,f),veccrossunit)
Next
Next
Dim normvecM, normvecN, planeptH, planeptV, planeptV2, planeptH2, planeptHV, planeptHV2, normvecM2, normvecN2, veccross2
Dim veccrossunit,crosssections, crosssectionV, crosssectionV2, veccrossunit2
Dim s,t
For m=0 To x-1
For n=0 To y-1
‘If (n = (y)) Or (m = (x)) Then
‘ normvecN=rhino.VectorCreate(arrpt(m,n),arrpt(m,n-1))
‘veccross=rhino.VectorCrossProduct(normvecM,normvecN)
‘ planept=planefromframe(arrpt(m,n),normvecM,veccross)
‘Else
‘Rhino.addpolyline array(arrpt(m,n),arrpt(m+1,n),arrpt(m+1,n+1),arrpt(m,n+1), arrpt(m,n))
normvecM=rhino.vectorcreate(arrpt(m,n),arrpt(m+1,n))
normvecN=rhino.VectorCreate(arrpt(m,n),arrpt(m,n+1))
‘veccross=rhino.VectorCrossProduct(normvecM,normvecN)
normvecM2=rhino.vectorcreate(arrpt(n,m),arrpt(n+1,m))
normvecN2=rhino.VectorCreate(arrpt(n,m),arrpt(n,m+1))
veccross2=rhino.VectorCrossProduct(normvecM2,normvecN2)
planeptH=planefromframe(arrpt(m,n),normvecM,veccross)
planeptH2=planefromframe(arrpt(n,m),normvecN,veccross)
planeptV=planefromframe(arrpt(m,n),normvecM,normvecN)
‘veccrossunit=rhino.VectorUnitize(veccross)
veccrossunit2=rhino.VectorUnitize(veccross2)
toppt2(n,m)=rhino.PointAdd(arrpt(n,m),veccrossunit2)
planeptV2=rhino.PlaneFromFrame(toppt(m,n),normvecM,normvecN)
planeptHV=rhino.planefromframe(toppt(m,n),normvecM,veccross)
planeptHV2=rhino.planefromframe(toppt2(n,m),normvecN2,veccross2)
‘End If
arrcircV(m,n)=addcircle(planeptV,0.1)
arrcircV2(m,n)=addcircle(planeptV2,0.1)
arrcircH(m,n)=addcircle(planeptH,0.1)
arrcircH2(m,n)=addcircle(planeptH2,0.1)
arrcircHV(m,n)=addcircle(planeptHV,0.1)
‘Rhino.Selectobject arrcircHV(m,n)
arrcircHV2(m,n)=addcircle(planeptHV2,0.1)
rhino.addloftsrf array(arrcircV(m,n),arrcircV2(m,n))
ReDim Preserve crosssectionsH(k): crosssectionsH(k)=extrudecurvestraight(arrcircH(m,n), arrpt(m,n),arrpt(m,n+1))
‘ReDim Preserve crosssectionsHV(k): crosssectionsHV(k)=extrudecurvestraight(arrcircHV(m,n),toppt(m,n),toppt(m,n+1))
ReDim Preserve crosssectionsH2(k): crosssectionsH2(k)=extrudecurvestraight(arrcircH2(m,n), arrpt(n,m),arrpt(n+1,m))
‘ReDim Preserve crossseionsHV2(k): crosssectionsHV2(k)=extrudecurvestraight(arrcircHV2(m,n),toppt2(m,n),toppt2(m,n+1))
k=k+1
Next
‘rhino.addloftsrf(crosssectionsH)
‘rhino.AddLoftSrf(crosssectionsH2)
‘rhino.addloftsrf(crosssectionsHV)
‘rhino.addloftsrf(crosssectionsHV2)
k=0
Next
Dim o,p
Dim normvecO, veccrossOP, normvecP,veccrossunitOP,toppt3(200,200),planeptOPV , arrcircOPV(200,200),crosssectionsOPV(), crosssectionsOPVD(), crosssectionsOPV2()
Dim vecdiagN, planeptOPV2
For p=0 To x-2
For o=0 To y-2
normvecO=rhino.vectorcreate(arrpt(o,p),arrpt(o+1,p))
normvecP=rhino.VectorCreate(arrpt(O,P),arrpt(O,P+1))
veccrossOP=rhino.VectorCrossProduct(normvecO,normvecP )
vecdiagN=rhino.VectorCreate(arrpt(o,p),arrpt(o+1,p+1))
veccrossunitOP=rhino.VectorUnitize(veccrossOP)
toppt3(o,p)=rhino.PointAdd(arrpt(o,p),veccrossunitOP)
planeptOPV=rhino.PlaneFromNormal(toppt3(o,p),vecdiagN)
arrcircOPV(o,p)=addcircle(planeptOPV,0.1)
planeptOPV2=rhino.PlaneFromFrame(toppt3(o,p),normvecP,veccrossOP)
ReDim Preserve crosssectionsOPV2(k): crosssectionsOPV2(k)=addcircle(planeptOPV2,0.1)
ReDim Preserve crosssectionsOPV(k): crosssectionsOPV(k)=rhino.extrudecurvestraight( arrcircHV(o,p),toppt(o,p),toppt(o,p+1))
‘ReDim Preserve crosssectionsOPV(k): crosssectionsOPV(k)=rhino.extrudecurvestraight( arrcircHV2(o,p),toppt(o,p),toppt(o,p+1))
ReDim Preserve crosssectionsOPVD(k): crosssectionsOPVD(k)=rhino.extrudecurvestraight(arrcircOPV(o,p),toppt(o,p),arrpt(o+1,p+1))
k=k+1
Next
rhino.addloftsrf(crosssectionsOPV2)
k=0
Next
Rhino.EnableRedraw (True)
End Sub
Posted in Uncategorized | Leave a Comment »
Option Explicit
‘Script written by <insert name>
‘Script copyrighted by <insert company name>
‘Script version Saturday, January 17, 2009 11:02:46 AM
Call Main()
Sub Main()
Dim arrAllPts()
Dim arrPerimPts()
Dim arrAllLines()
Dim realLine1, realLine2, realLine3
Dim intI
Dim arrApexPt
Dim strCircumCirc
‘drawing the first triangle
realLine1 = Rhino.GetReal(“Give length of 1st member”)
realLine2 = Rhino.GetReal(“Give length of 2nd member”)
realLine3 = Rhino.GetReal(“Give length of 3rd member”)
ReDim Preserve arrAllPts(0) : arrAllPts(0) = Array(0,1,0)
ReDim Preserve arrAllPts(1) : arrAllPts(1) = Array(realLine1,1,0)
ReDim Preserve arrAllLines(0) : arrAllLines(0) = Rhino.AddLine(arrAllPts(0), arrAllPts(1))
ReDim Preserve arrAllPts(2) : arrAllPts(2) = twoPtTriangle (arrAllLines(0), realLine2, realLine3, Array(0,0,0))
ReDim Preserve arrAllLines(1) : arrAllLines(1) = Rhino.AddLine(arrAllPts(0), arrAllPts(2))
ReDim Preserve arrAllLines(2) : arrAllLines(2) = Rhino.AddLine(arrAllPts(1), arrAllPts(2))
strCircumCirc = Rhino.AddCircle3Pt(arrAllPts(0), arrAllPts(1), arrAllPts(2))
arrApexPt = Rhino.CircleCenterPoint(strCircumCirc)
rhino.DeleteObject strCircumCirc
rhino.AddPoint arrApexPt
‘perimeter analysis and drawing subsequent triangles
For intI = 0 To UBound(arrAllPts)
ReDim Preserve arrPerimPts(intI) : arrPerimPts(intI) = arrAllPts(intI)
Next
Dim strLineTemp1, strLineTemp2, intIminOne, intIplusOne
Dim arrIntersect
For intI = 0 To UBound(arrPerimPts)
strLineTemp1 = Rhino.AddLine(arrPerimPts(intI), arrApexPt)
If intI = 0 Then
intIminOne = UBound(arrPerimPts)
Else
intIminOne = intI – 1
End If
If intI = UBound(arrPerimPts) Then
intIplusOne = 0
Else
intIplusOne = intI + 1
End If
strLineTemp2 = Rhino.AddLine(arrPerimPts(intIplusOne),arrPerimPts(intIminOne))
arrIntersect = Rhino.CurveCurveIntersection(strLineTemp1, strLineTemp2)
If Not IsArray(arrIntersect) Then
strLineTemp1 = Rhino.ExtendCurve(strLineTemp1,0,0, Array(strLineTemp2))
If strLineTemp1 <> vbNull Then
arrIntersect = Rhino.CurveCurveIntersection(strLineTemp1, strLineTemp2)
Else
‘Rhino.Print(“Did not intersect from end point”)
strLineTemp1 = Rhino.ExtendCurve(strLineTemp1,0,1, Array(strLineTemp2))
arrIntersect = Rhino.CurveCurveIntersection(strLineTemp1, strLineTemp2)
End If
End If
Rhino.AddPoint(arrIntersect(0,1))
Next
End Sub
Function twoPtTriangle(strLine, realLength1, realLength2, arrDirPt)
Dim arrCircPlane
Dim arrOrigin
Dim arrX
Dim strCirc1, strCirc2
Dim arrIntPts
Dim strIntPt1, strIntPt2
Dim arrIntPt1, arrIntPt2
Dim realDist1, realDist2
arrOrigin = Rhino.CurveStartPoint(strLine)
arrX = Rhino.CurveEndPoint(strLine)
arrCircPlane = Rhino.PlaneFromPoints(arrOrigin, arrX, arrDirPt)
strCirc1 = Rhino.AddCircle(arrCircPlane, realLength1)
arrOrigin = Rhino.CurveEndPoint(strLine)
arrX = Rhino.CurveStartPoint(strLine)
arrCircPlane = Rhino.PlaneFromPoints(arrOrigin, arrX, arrDirPt)
strCirc2 = Rhino.AddCircle(arrCircPlane, realLength2)
arrIntPts = Rhino.CurveCurveIntersection(strCirc1, strCirc2)
strIntPt1 = rhino.AddPoint (arrIntPts(0,1))
strIntPt2 = rhino.AddPoint (arrIntPts(1,1))
arrIntPt1 = Rhino.PointCoordinates(strIntPt1)
arrIntPt2 = Rhino.PointCoordinates(strIntPt2)
realDist1 = Rhino.Distance(arrIntPt1, Array(0,0,0))
realDist2 = Rhino.Distance(arrIntPt2, arrDirPt)
If (realDist1 > realDist2) Then
twoPtTriangle = arrIntPt2
Else
twoPtTriangle = arrIntPt1
End If
rhino.DeleteObject strIntPt1
rhino.DeleteObject strIntPt2
rhino.DeleteObject strCirc1
rhino.DeleteObject strCirc2
End Function
Posted in Uncategorized | Leave a Comment »
Dirty Codes:
Call Main()
Sub Main()
Dim j,i
For j=0 To 5
For i=0 To 5
Dim x : x = cos(i)/5
Dim r : r = 0.5 + x
Dim circlea : circlea = Rhino.command (“circle “&i&”,”&j&”,0 1″)
Dim circleb : circleb = Rhino.command (“circle “&i&”,”&j&”,1 “&r&””)
rhino.command “selall”
rhino.command “-loft enter enter”
rhino.command “selnone”
rhino.command “selcrv”
rhino.command “delete”
Next
Next
End Sub
Using 2 Surfaces for 3D Tesselation
Call Main()
Sub Main()
‘Get surface
Dim strobject1 : strobject1 = rhino.GetObject(“select surface1”, 8)
Dim strobject2 : strobject2 = rhino.GetObject(“select surface2”, 8)
‘get number of x & y
Dim intX : intX = rhino.GetInteger(“Number of Row”,10,,200)
intX = intX – 1
Dim intY : intY = rhino.GetInteger(“Number of Columns”,10,,200)
intX = intX – 1
‘get U V points
Dim U1 : U1 = Rhino.SurfaceDomain (strObject1, 0)
Dim V1 : V1 = Rhino.SurfaceDomain (strObject1, 1)
Dim U2 : U2 = Rhino.SurfaceDomain (strObject2, 0)
Dim V2 : V2 = Rhino.SurfaceDomain (strObject2, 1)
‘loop & convert through UV for x and y & NAME the points
Dim i,j,k,l
Dim arrPt1 (200,200)
Dim arrParameter1(1)
Dim arrPt2 (200,200)
Dim arrParameter2(1)
‘name the points into array
For i=0 To intX
arrParameter1(0) = U1(0) + (((U1(1)- U1(0)) / intX) * i)
For j=0 To intY
arrParameter1(1) = V1(0) + (((V1(1)- V1(0)) / intY) * j)
arrPt1(i,j) = Rhino.EvaluateSurface (strObject1, arrParameter1)
Next
Next
For k=0 To intX
arrParameter2(0) = U2(0) + (((U2(1)- U2(0)) / intX) * k)
For l=0 To intY
arrParameter2(1) = V2(0) + (((V2(1)- V2(0)) / intY) * l)
arrPt2(k,l) = Rhino.EvaluateSurface (strObject2, arrParameter2)
Next
Next
‘draw an object for the loop
Dim m,n
For m = 0 To (intX-1)
For n = 0 To (intY-1)
Rhino.AddPolyline Array(arrPt1(m,n),arrPt2(m+1,n),arrPt1(m+1,n),arrPt1(m,n))
Rhino.AddPolyline Array(arrPt1(m,n),arrPt2(m,n+1),arrPt1(m+1,n),arrPt1(m,n))
Next
Next
End Sub
Lofted Skin (doesn’t work)
Option Explicit
‘Script written by <insert name>
‘Script copyrighted by <insert company name>
‘Script version Tuesday, January 13, 2009 4:43:38 PM
Call Main()
Sub Main()
‘Get surface
Dim strobject1 : strobject1 = rhino.GetObject(“select surface1”, 8)
Dim strobject2 : strobject2 = rhino.GetObject(“select surface2”, 8)
‘get number of x & y
Dim intX : intX = rhino.GetInteger(“Number of Row”,10,,200)
intX = intX – 1
Dim intY : intY = rhino.GetInteger(“Number of Columns”,10,,200)
intX = intX – 1
‘get U V points
Dim U1 : U1 = Rhino.SurfaceDomain (strObject1, 0)
Dim V1 : V1 = Rhino.SurfaceDomain (strObject1, 1)
Dim U2 : U2 = Rhino.SurfaceDomain (strObject2, 0)
Dim V2 : V2 = Rhino.SurfaceDomain (strObject2, 1)
‘loop & convert through UV for x and y & NAME the points
Dim i,j,k,l
Dim arrPt1 (200,200)
Dim arrParameter1(1)
Dim arrPt2 (200,200)
Dim arrParameter2(1)
‘name the points into array
For i=0 To intX
arrParameter1(0) = U1(0) + (((U1(1)- U1(0)) / intX) * i)
For j=0 To intY
arrParameter1(1) = V1(0) + (((V1(1)- V1(0)) / intY) * j)
arrPt1(i,j) = Rhino.EvaluateSurface (strObject1, arrParameter1)
Next
Next
For k=0 To intX
arrParameter2(0) = U2(0) + (((U2(1)- U2(0)) / intX) * k)
For l=0 To intY
arrParameter2(1) = V2(0) + (((V2(1)- V2(0)) / intY) * l)
arrPt2(k,l) = Rhino.EvaluateSurface (strObject2, arrParameter2)
Next
Next
‘draw an object for the loop
Dim m,n
For m = 0 To (intX-1)
For n = 0 To (intY-1)
Rhino.AddPolyline Array(arrPt1(m,n),arrPt2(m+1,n),arrPt1(m+1,n),arrPt1(m,n))
Rhino.AddPolyline Array(arrPt1(m,n),arrPt2(m,n+1),arrPt1(m+1,n),arrPt1(m,n))
‘draw circle
Dim arrFirst1 : arrFirst1 = Array(arrPt1(m,n),arrPt1(m,n),arrPt1(m,n))
Dim arrSecond1 : arrSecond1 = Array(arrPt1(m+1,n),arrPt1(m,n),arrPt1(m,n))
Dim arrThird1 : arrThird1 = Array(arrPt1(m+1,n),arrPt1(m,n+1),arrPt1(m,n))
Dim myCircle1(m,n) : myCircle1(m,n) = Rhino.AddCircle3Pt (arrFirst1, arrSecond1, arrThird1)
ReDim myCircle1(n) : myCircle1(n) = mycircle1
Dim arrFirst2 : arrFirst2 = Array(arrPt2(m,n),arrPt2(m,n),arrPt2(m,n))
Dim arrSecond2 : arrSecond2 = Array(arrPt2(m+1,n),arrPt2(m,n),arrPt2(m,n))
Dim arrThird2 : arrThird2 = Array(arrPt2(m+1,n),arrPt2(m,n+1),arrPt2(m,n))
Dim myCircle2(m,n) : myCircle2(m,n) = Rhino.AddCircle3Pt (arrFirst2, arrSecond2, arrThird2)
ReDim myCircle2(n) : myCircle2(n) = mycircle2
‘loft the circle
Dim arrCircles : arrCircles = rhino.selectobject (myCircle1(n), myCircle2(n))
Rhino.AddLoftSrf arrCircles, 0
Next
Next
End Sub
Posted in Uncategorized | Leave a Comment »
‘Jess Sundberg******************************************************
‘January 14, 2008
‘HyperbolicParabaloid Surface Diagrid Study
‘MIT Department of Civil and Environmental Engineering
‘Masters of Engineering Thesis, Spring 2009
‘Advisor, Jerome Connor
‘*******************************************************************
Option Explicit
Call Main
Sub Main()
‘USER INPUT//NUMBER OF STORIES + DIAGRID modules
Dim Public Const DaysInYear = 365
Dim intStories : intStories = Rhino.GetInteger(“Input height of tower in stories”,100,,300)
Dim dblRadius : dblRadius = Rhino.GetInteger(“Input radius of the base of the tower”, 20,,100)
Dim intGrid : intGrid = Rhino.GetInteger(“Input the number of diagrid modules”, 8)
‘define final surface, to be updated by calling functions
Dim arrShape()
”Draw surface of hyperbolic parabaloid
Call addDrawHyperParab(intStories, intGrid, arrShape, dblRadius)
”Draw diagrid On surface
Call addDrawDiagrid(arrShape, intStories, intGrid, dblRadius)
End Sub
Private Function addDrawHyperParab(ByVal intS, ByVal intG, ByVal arrShell, ByVal dblR)
‘convert height and define translation vectors
Dim intH : intH = intS*3.5
Dim arrXvec : arrXvec = Array(1,0,0)
Dim arrYvec : arrYvec = Array(0,1,0)
Dim arrZvec : arrZvec = Array(0,0,1)
‘BASE CIRCLE draw circle on origin
Dim strBase
Dim arrPlane
arrPlane = Rhino.WorldXYPlane
strBase = Rhino.AddCircle (arrPlane, dblR)
‘TOP CIRCLE creates translation vector to get ‘roof’
Dim vecHeight
vecHeight = Rhino.VectorScale(arrZvec, intH)
‘copies the circle to top of tower
Dim strTop : strTop = Rhino.CopyObject(strBase , vecHeight)
‘CENTER CIRCLE draws center circle
Dim dblRr : dblRr = Rhino.GetInteger(“Input radius of tower in meters at smallest point”,15,,300)
Dim strWaist : strWaist = Rhino.AddCircle (arrPlane, dblRr)
‘moves circle to waist of tower
Dim dblH : dblH = Rhino.GetInteger(“At what percent of the height (0-100) does the skinniest point occur?”, 50,,100)
‘makes the translation vector for waist
Dim intScl : intScl = (dblH/100)*intH
Dim vecWaist : vecWaist = Rhino.VectorScale(arrZvec, intScl)
strWaist = Rhino.MoveObject (strWaist, vecWaist)
‘SURFACE LOFT lofts the curves to make surface shape
Dim arrCvs : arrCvs = Array(strBase, strWaist, strTop)
arrShell = Rhino.AddLoftSrf(arrCvs)
End Function
Function addDrawDiagrid (ByVal arrSurface, ByVal intS, ByVal intG, ByVal dblR )
Dim i,j,k,l,x
Dim m,n
‘use arrShape as arrSurface
‘convert height
Dim intH : intH = intStories*3.5
”VERTICAL LINE of PTS
‘makes an invisible vertical line of points as tall as the tower, adjacent to the tower
Dim strObject : strObject = Rhino.GetObject(“Select surface to apply diagrid”)
For i = 0 To intStories
Dim arrPoint : arrPoint = Array(dblR ,0,(i*3.5))
Call Rhino.addPoint(arrPoint)
‘find points on surface closest to line of points, return UV parameters
Dim arrUVPtParam : arrUVPtParam = Rhino.SurfaceClosestPoint (strObject, arrPoint)
‘store variable only if Z coordinates are identical- pt on surface and arrPoint
Dim arrLocation : arrLocation = Rhino.PointCoordinates(arrUVPtParam)
‘check if vectors are parallel, then will be in same z coordinates
‘Dim intQ
‘intQ = Rhino.IsVectorParallelTo(arrLocation, arrPoint)
‘If intQ <>1 Then
‘keep trying, refine?
”write a function that can loop and refine– recursion
”redefine arrUVPtParam
‘ Else
‘Call Rhino.addPoint(arrUVPtParam)
‘End If
‘store each point’s surface parameters
Dim arrCvPts (intStories)
arrCvPts(i) = arrUVPtParam
Next
‘PARAMETER create parameter
Dim arrParameter()
‘get surface domain
Dim arrU : arrU = Rhino.SurfaceDomain(strObject, 0)
Dim arrV : arrV = Rhino.SurfaceDomain(strObject, 1)
‘extracts curves along points, return curve objects if successful
Dim arrCvs : arrCvs = Rhino.ExtractIsoCurve(strObject, arrUVPtParam, 2)
‘calculates the v distance between points along surface and places them in an array
Dim arrLength(intStories)
For x= 0 To (intStories+1)
If x>0 Then
Dim arrCvDm : arrCvDm = Rhino.CurveDomain(arrCvs(1))
arrLength(x) = Rhino.CurveLength(arrCvs(1), , Array(arrUVPtParam(x-1), arrUVPtParam(x)))
Else arrLength(x) = 0
End If
Next
‘evaluate
For m=0 To (2*intG)
‘parameterize around the tower
arrParameter(0) = arrU(0) +(((arrU(1) – arrU(0))/ (2*intG)*m)
For n=0 To (intStories+1)
‘parameterize in the v direction
Dim arrLengthSum
If n= 0 Then
arrLengthSum(0) = 0
Else
arrLengthSum(n)= arrLengthSum(n-1)+ arrLenth(n)
End If
arrParameter(1) = arrLengthSum
arrPt(m,n) = Rhino.EvaluateSurface (strObject, arrParameter)
Next
Next
‘ DIAGRID draw all triangle panels using points created
For k = 0 To intG
For l = 0 To intStories Step 2
If l = 0 Then
Rhino.AddPolyline Array(arrPt(k,l),arrPt(k+1,l),arrPt((k+(1/2)),l),arrPt(k,l))
‘add something for horizontals
Rhino.AddPolyline Array(arrPt((k+(1/2)),l+1), arrPt((k+(3/2)),l+1)
Else If (intStories+1) Mod 2 <> 1 And 0 < l < (intStories+1) ‘if even number of floors
Rhino.AddPolyline Array(arrPt(k,l),arrPt(k+1,l),arrPt((k+(1/2)),l),arrPt(k,l))
Rhino.AddPolyline Array(arrPt(k,l),arrPt((k+(1/2)),l-1),arrPt(k+1,l))
Rhino.AddPolyline Array(arrPt((k+(1/2)),l+1), arrPt((k+(3/2)),l+1)
Else
‘odd number of floors, final floor polylines
Rhino.AddPolyline Array(arrPt(k,l), arrPt((k+(1/2)),l-1), arrPt(k+1,l))
End If
Next
Next
End Function
Posted in Uncategorized | 1 Comment »
 Option Explicit
‘Script written by <Masoud Akbarzadeh>
‘Script copyrighted by <MIT Deoartment of Architecture>
‘Script version Tuesday, January 13, 2009 4:45:31 PM
Call spaceframe V.1()
Sub spaceframe V.1()
Dim i,j,m,n,k
Dim arrpt(200,200), toppt(200,200), toppt2(200,200)
Dim arrparam(1)
Dim strobj
Dim arrcircV(200,200), arrcircV2(200,200),arrcircH(200,200),arrcircH2(200,200), arrcircHV(200,200), arrcircHV2(200,200)
Dim crosssectionsV(200,200), arrcrossHV(200,200)
Dim crosssectionsH(),crosssectionsH2(),crosssectionsHV(), crosssectionsHV2()
strobj=Rhino.getobject (“select the object”, 8)
Dim x : x=Rhino.Getinteger (“enter the number”, 10,,200)
Dim y : y=Rhino.GetInteger (“enter the number”,10,,200)
x=x-1
y=y-1
Dim u
u=Rhino.surfacedomain (strobj,0)
Dim v
v=Rhino.surfacedomain (strobj,1)
‘loop through u and V to get x and y
For i=0 To x
arrparam(0) = u(0) + (((u(1) – u(0)) / x) * i)
For j=0 To y
arrparam(1) = v(0) + (((v(1) – v(0))/y)*j)
arrpt(i,j)=Rhino.evaluatesurface(strobj,arrparam)
Next
Next
Dim normvecM, normvecN, veccross, planeptH, planeptV, planeptV2, planeptH2, planeptHV, planeptHV2, normvecM2, normvecN2, veccross2
Dim veccrossunit,crosssections, crosssectionV, crosssectionV2, veccrossunit2
Dim s,t
For m=0 To x-1
For n=0 To y-1
‘If (n = (y)) Or (m = (x)) Then
‘ normvecN=rhino.VectorCreate(arrpt(m,n),arrpt(m,n-1))
‘veccross=rhino.VectorCrossProduct(normvecM,normvecN)
‘ planept=planefromframe(arrpt(m,n),normvecM,veccross)
‘Else
‘Rhino.addpolyline array(arrpt(m,n),arrpt(m+1,n),arrpt(m+1,n+1),arrpt(m,n+1), arrpt(m,n))
normvecM=rhino.vectorcreate(arrpt(m,n),arrpt(m+1,n))
normvecN=rhino.VectorCreate(arrpt(m,n),arrpt(m,n+1))
veccross=rhino.VectorCrossProduct(normvecM,normvecN)
normvecM2=rhino.vectorcreate(arrpt(n,m),arrpt(n+1,m))
normvecN2=rhino.VectorCreate(arrpt(n,m),arrpt(n,m+1))
veccross2=rhino.VectorCrossProduct(normvecM2,normvecN2)
planeptH=planefromframe(arrpt(m,n),normvecM,veccross)
planeptH2=planefromframe(arrpt(n,m),normvecN,veccross)
planeptV=planefromframe(arrpt(m,n),normvecM,normvecN)
veccrossunit=rhino.VectorUnitize(veccross)
veccrossunit2=rhino.VectorUnitize(veccross2)
toppt(m,n)=rhino.PointAdd(arrpt(m,n),veccrossunit)
toppt2(n,m)=rhino.PointAdd(arrpt(n,m),veccrossunit2)
planeptV2=rhino.PlaneFromFrame(toppt(m,n),normvecM,normvecN)
planeptHV=rhino.planefromframe(toppt(m,n),normvecM,veccross)
planeptHV2=rhino.planefromframe(toppt2(n,m),normvecN2,veccross2)
‘End If
arrcircV(m,n)=addcircle(planeptV,0.1)
arrcircV2(m,n)=addcircle(planeptV2,0.1)
arrcircH(m,n)=addcircle(planeptH,0.1)
arrcircH2(m,n)=addcircle(planeptH2,0.1)
arrcircHV(m,n)=addcircle(planeptHV,0.1)
arrcircHV2(m,n)=addcircle(planeptHV2,0.1)
rhino.addloftsrf array(arrcircV(m,n),arrcircV2(m,n))
ReDim Preserve crosssectionsH(k): crosssectionsH(k)=addcircle(planeptH,0.1)
ReDim Preserve crosssectionsHV(k): crosssectionsHV(k)=addcircle(planeptHV,0.1)
ReDim Preserve crosssectionsH2(k): crosssectionsH2(k)=addcircle(planeptH2,0.1)
‘ReDim Preserve crossseionsHV2(k): crosssectionsHV2(k)=addcircle(planeptHV2,0.1)
k=k+1
Next
rhino.addloftsrf(crosssectionsH)
rhino.AddLoftSrf(crosssectionsH2)
rhino.addloftsrf(crosssectionsHV)
‘rhino.addloftsrf(crosssectionsHV2)
k=0
Next
Dim o,p
Dim normvecO, veccrossOP, normvecP,veccrossunitOP,toppt3(200,200),planeptOPV , arrcircOPV(200,200),crosssectionsOPV(), crosssectionsOPVD()
Dim vecdiagN
For p=0 To x-1
For o=0 To y-1
normvecO=rhino.vectorcreate(arrpt(o,p),arrpt(o+1,p))
normvecP=rhino.VectorCreate(arrpt(O,P),arrpt(O,P+1))
veccrossOP=rhino.VectorCrossProduct(normvecO,normvecP )
vecdiagN=rhino.VectorCreate(arrpt(o,p),arrpt(o+1,p+1))
veccrossunitOP=rhino.VectorUnitize(veccrossOP)
toppt3(o,p)=rhino.PointAdd(arrpt(o,p),veccrossunitOP)
planeptOPV=rhino.PlaneFromFrame(toppt3(o,p),normvecP,veccrossOP)
arrcircOPV(o,p)=addcircle(planeptOPV,0.1)
ReDim Preserve crosssectionsOPV(k): crosssectionsOPV(k)=addcircle(planeptOPV,0.1)
ReDim Preserve crosssectionsOPVD(k): crosssectionsOPV(k)=rhino.extrudecurvestraight(arrcircOPV(o,p),toppt3(o,p),arrpt(o+1,p+1))
k=k+1
Next
rhino.addloftsrf(crosssectionsOPV)
k=0
Next
End Sub
Posted in Uncategorized | 2 Comments »
I came across a couple examples of scripted forms that use text. I thought this was one of the most interesting and could be useful for demonstrating the shifting data as well as drawing form around information lines. I like the way is works with a base grid… seems easier to decipher what the form is tracking.
Source: http://www.new-territories.com/I’veheardabout.htm


Posted in Uncategorized | Leave a Comment »
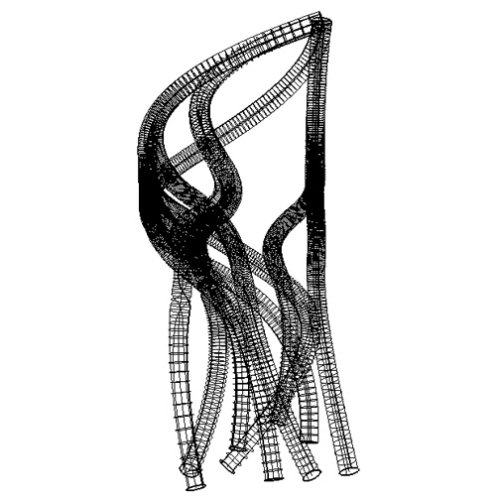
These are some simplified examples of the final form I’d like to achieve. The distribution goes from a set grid at the base to a tapered endpoint at its peak. The polylines represent a shifting of languages and grouping of speakers. I’d like to alter the width of the lines to demonstrate their increase in value. I’m also thinking of ways I could incorporate text into this form so that it is legible along its data points.



Posted in Uncategorized | Leave a Comment »
Call Main()
Dim x,y,z
Dim arrpt(10)
Dim arrGDP : arrGDP = Array(1,2,3,4,5,6,7,8,9,10)
Dim arrSp : arrSp = Array(5,4,3,2,1,6,7,8,9,10)
‘Create Points and Assign Name
For x = 0 to 9
arrpt (x) = Rhino.AddPoint Array(0,0,0)
arrpt(x) = Rhino.ObjectName Array(arrGDP(x), arrSp(x))
Next
‘Move randomly every week
For y = 0 To 9
Rhino.MoveObject arrpt(y), Array(0,0,0), (RND*arrGDP(y))
Next
For
‘Find lowest value of arrGDP + arrSp
For z = 0 To 9
Rhino.GetObject (strLowestValue, 1)
Rhino.GetObject (strHighestValue, 1)
Next
‘Change the highest value to include the lowest value
For z = 0 to 9
Rhino.MoveObject
Next
Next
End Sub
Posted in Uncategorized | Leave a Comment »
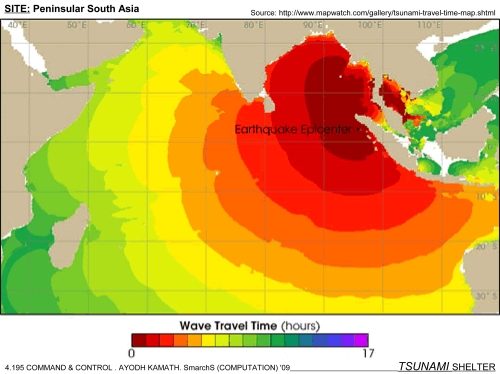
This website has waave height data for the 2004 Indian Ocean tsunami.
Posted in Uncategorized | Leave a Comment »
Starting working on the actual scripting, here’s were it currently stands. In between Functions so it might not run as posted.
Option Explicit

'Script written by Aaron Willette

'Script copyrighted under Creative Commons Attribution-Noncommercial-Share Alike 3.0

'http://pxlhor.blogspot.com

'aaron.willette@gmail.com

'Script version Thursday, January 15, 2009 4:47:06 PM
‘ REMINDER: SET COLORS FOR LAYERS
Call Main()
Sub Main()‘make necessary layers
Dim L1 : L1 = “male_infected”
Call makeLayer(L1)Dim L2 : L2 = “male_clean”
Call makeLayer(L2)Dim L3 : L3 = “female_infected”
Call makeLayer(L3)Dim L4 : L4 = “female_clean”
Call makeLayer(L4)Dim L5 : L5 = “arch_system”
Call makeLayer(L5)Dim L6 : L6 = “buildings”
Call makeLayer(L6)Dim L7 : L7 = “boundary”
Call makeLayer(L7)‘select city
Dim arrList : arrList = Array(“Boston”, “Los Angeles”)
If Not IsArray(arrList) Then Exit SubDim strCity : strCity = Rhino.GetString(“Select city”,”Los Angeles”,arrList) ‘not listing whole arrList
If IsNull(strCity) Then Exit SubDim arrProps
arrProps = getCProps(strCity)
If Not IsArray(arrProps) Then Exit Sub‘select buildings
Dim arrBldgs : arrBldgs = Rhino.GetObjects(“Select buildings”,4)
If Not IsArray(arrBldgs) Then Exit SubCall Rhino.ObjectLayer(arrBldgs, L6)
‘set boundary area
Dim strMessage : strMessage = “Define area to populate”
Dim strBound : strBound = setArea(strMessage)
If IsNull(strBound) Then Exit SubCall Rhino.ObjectLayer(strBound, L7)
‘populate area
Dim arrPop : arrPop = popArea(strBound, strCity)
If Not IsArray(arrPop) Then Exit SubEnd Sub
Function makeLayer(ByVal strLayer)
If Rhino.IsLayer(strLayer) Then
Exit Function
Else
Rhino.AddLayer(strLayer)
End IfEnd Function
Function getCProps(ByVal strCity)
Dim arrProps
Select Case strCity
Case “Boston”
arrProps = Array(CDbl(12166),CDbl(),CDbl(),CDbl()) ‘(ppl/sqmile, usable population, %male, %female)
Case “Los Angeles”
arrProps = Array(1,1) ‘placeholder value until actual figured out
Case Else
Exit Function
End SelectgetCProps = arrProps
End Function
Function setArea(strMessage)
Dim arrPoints : arrPoints = Rhino.GetPoints(True,True,strMessage)
If Not IsArray(arrPoints) Then Exit FunctionReDim Preserve arrPoints(UBound(arrPoints)+1)
arrPoints(UBound(arrPoints)) = arrPoints(0)setArea = Rhino.AddPolyline(arrPoints)
End Function
Function popArea(strBound, strCity)
‘make boundary a surface
Dim arrSurfEdge : arrSurfEdge = Rhino.ExplodeCurves(strBound)
If Not IsArray(arrSurfEdge) Then Exit FunctionDim strSurf : strSurf = Rhino.AddPlanarSrf(arrSurfEdge)
If IsNull(strSurf) Then Exit FunctionCall Rhino.DeleteObjects(arrSurfEdge)
‘get UV of surface
Dim arrU : arrU = Rhino.SurfaceDomain(strSurf,0)
Dim arrV : arrV = Rhino.SurfaceDomain(strSurf,1)End Function
Posted in Uncategorized | Leave a Comment »
s l o w accretions
I have decided to go along with the concept of a catastrophic event occurring at a very slow pace: the slow rise in global temperatures and their resultant effect on the sea water level, which is physically threatening coastlines and small islands.
/context: Tokyo/Mauritius/Manhattan. I would like to steer away from the context of Manhattan, since it has been so worked on, but the readily available abundance of information on it might be the very reason why I will pick it. Its topology might not be that interesting to look at, however, since I imagine it is mostly constructed, especially its interface with the water, as can be seen by its reticulated edges.
/constants topology along the island
/variables: rate of temperature increase:
time and
amount of rise of water level. The amount of the rise is dependent on another series of variables: see table below.
/urban networks: transport e.g.subway/road
communications e.g. electricity/
virtual communications e.g. satellite/ I have noticed that satellite reception for GPS(es) is worse in denser urban areas, where the waves bounce off the buildings. Perhaps the height of the buildings, or the urban density might be another variable for this virtual communications network system then?
piping systems e.g. sewage/water supply
//building foundations: what would happen to them? Would they be affected at all? That would be very interesting to research//
/datums: We can assume that once certain datums will be reached, other previously unrelated systems will become new parameters related to the problem at hand. For instance, once the subway lines are completely flooded, another public transportation method will be devised, such as a novel railcar network between the tallest skyscrapers. Or, as humanity suffers yet another traumatic upheaval, some new technological innovation causes obsolescence in some existing networks such as, oh I don’t know, the electricity grid becoming irrelevant as we start to power our own machines in a more local way.
Some datums:
01. Rate of rise in water level (time, height of water).
02. Subway/road network no longer usable at certain nodes >> what happens then? How does my script react to the situation?
PSEUDO CODE
My list needs to be pared down obviously. I will start with scripting the urban pedestrian transportation networks (roads and subway). Once I have the script, it can then be modified and applied to the other urban networks.
/ create a 3D NURBS surface topology of Manhattan.
/ create the network of subway: lines A, B, C, D, with information on the depth of the subway underground and the nodal connections between the lines (x, y, z point coordinates for all the subway stations)
/ create the linear network of road systems
/ apply the road network to the topographical NURBS surface
/ if then….distance needed to walk > int D, then subway
(assumptions: no economic relationships or predictions)
/ apply datums: if, then conditions
/loop 01: physical rise in water level > l1 AND distance to walk > d1
I am stuck here, because I am having trouble figuring out what happens when my datums are reached…any advice?
Posted in Uncategorized | Leave a Comment »
Strangely, I got no errors in any of the first fifteen sample scripts from Rhino 101. I’m probably doing something wrong!
Posted in Uncategorized | Leave a Comment »
The intention of this Pseudo-Code is to morph a given architectural enclosure (in this instance, a spherical body) into a more aerodynamic form (a teardrop) as a result of hurricane wind speed and direction. This morphing enclosure would allow hurricane force winds to move past an architectural enclosure without causing shear damage and a resultant wake. The enclosure would be responsive to the magnitude of the hurricane winds speed, causing greater deformation with higher wind speed, and the “teardrop” geometry forming along a parallel axis to the hurricane wind direction. In addition, the architectural body would be responsive to the surrounding water level, causing the principle architectural body to rise along a central core as the water level rises.
*The principle/stasis-state architectural form could be created before the script or created as part of the script
Given: A spherical architectural body with a separate base structure and central, cylindrical core element
_Subdivide sphere into a defined number of sections
_Create panels from these sections to form the architectural skin of the structure
_Introduce input data of Hurricane wind speed as magnitude and vector
_For each panel, analyze its location in relation to hurricane wind origin point and to the other panels
_Create polyline as a working axis which begins from the panel nearest the hurricane origin point and extends in a parallel direction along the sphere’s central axis
_Create “teardrop” curve along the working axis defined by parametric equations
_Extrude curve by revolving around a line connecting the curve endpoints along the working axis to create “teardrop surface”
_Loop – Panel Deformation/Reorientation
*This loop takes each panel and relocates/reorients it to morph the spherical enclosure into one approximating the “teardrop” enclosure – this process may require many more steps than are illustrated below
_For each panel, analyze its location relative to the “teardrop” surface
_Relocate panel to approximate location along “teardrop” surface
_Delete construction geometry
_Condition – Architectural Body Location relative to water level
_Identify plane of “water level” as a result of storm surge
_If “water level” is higher in the “Z” direction than the central axis of the architectural body, move the architectural body in the “Z” direction so that the central axis is higher than the “water level”
_If not, take no action
Posted in Uncategorized | Leave a Comment »
To create a geodesic it will be imperative for me to deal with linear members which form triangles, and nodes where they join. I modified the surface subdivision code to construct triangles made up of single lines and introduced a set of conditionals that ensure that there are no overlapping lines. The lines thus constructed are placed in an array so that each line can then be manipulated in the future. Visually, however, the result of the script is just a triangulated surface. Here’s the code:
Option Explicit
‘Script written by <insert name>
‘Script copyrighted by <insert company name>
‘Script version Tuesday, January 13, 2009 4:44:45 PM
Call Main()
Sub Main()
Dim strObject : strObject = Rhino.GetObject(“Select Surface:”, 8)
‘Get integers x, y
Dim intX, intY
intX = Rhino.GetInteger(“Give X divisions”, 10, 2, 200)
intY = Rhino.GetInteger(“Give Y divisions”, 10, 2, 200)
intX = intX-1
intY = intY-1
‘Get surface domain
Dim arrU, arrV
arrU = Rhino.SurfaceDomain(strObject, 0)
arrV = Rhino.SurfaceDomain(strObject, 1)
‘Loop through U & V to get x & y
Dim intI, intJ
Dim arrPt(200, 200)
Dim arrParam(1)
For intI = 0 To intX
arrParam(0) = arrU(0)+(((arrU(1)-arrU(0)) / intX)*intI)
For intJ = 0 To intY
arrParam(1) = arrV(0)+(((arrV(1)-arrV(0)) / intY)*intJ)
arrPt(intI, intJ) = Rhino.EvaluateSurface(strObject, arrParam)
Next
Next
‘triangulate without overlapping lines
Dim intM, intN
Dim arrLin()
Dim intCount
For intM = 0 To (intX-1)
For intN = 0 To (intY-1)
If (intM Mod 2 = 0) And (intN Mod 2 = 0) Then
ReDim Preserve arrLin(intCount): arrLin(intCount) = Rhino.AddLine (arrPt(intM, intN), arrPt(intM+1, intN))
intCount = intCount + 1
ReDim Preserve arrLin(intCount): arrLin(intCount) = Rhino.AddLine (arrPt(intM+1, intN), arrPt(intM+1, intN+1))
intCount = intCount + 1
ReDim Preserve arrLin(intCount): arrLin(intCount) = Rhino.AddLine (arrPt(intM+1, intN+1), arrPt(intM, intN))
intCount = intCount + 1
ReDim Preserve arrLin(intCount): arrLin(intCount) = Rhino.AddLine (arrPt(intM+1, intN+1), arrPt(intM, intN+1))
intCount = intCount + 1
ReDim Preserve arrLin(intCount): arrLin(intCount) = Rhino.AddLine (arrPt(intM, intN+1), arrPt(intM, intN))
intCount = intCount + 1
ElseIf (intM Mod 2 <> 0) And (intN Mod 2 = 0) Then
ReDim Preserve arrLin(intCount): arrLin(intCount) = Rhino.AddLine (arrPt(intM, intN), arrPt(intM+1, intN))
intCount = intCount + 1
ReDim Preserve arrLin(intCount): arrLin(intCount) = Rhino.AddLine (arrPt(intM+1, intN+1), arrPt(intM, intN+1))
intCount = intCount + 1
ReDim Preserve arrLin(intCount): arrLin(intCount) = Rhino.AddLine (arrPt(intM+1, intN+1), arrPt(intM, intN))
intCount = intCount + 1
ElseIf (intM Mod 2 = 0) And (intN Mod 2 <> 0) Then
ReDim Preserve arrLin(intCount): arrLin(intCount) = Rhino.AddLine (arrPt(intM, intN), arrPt(intM, intN+1))
intCount = intCount + 1
ReDim Preserve arrLin(intCount): arrLin(intCount) = Rhino.AddLine (arrPt(intM, intN), arrPt(intM+1, intN+1))
intCount = intCount + 1
ReDim Preserve arrLin(intCount): arrLin(intCount) = Rhino.AddLine (arrPt(intM+1, intN+1), arrPt(intM+1, intN))
intCount = intCount + 1
ElseIf (intM Mod 2 <> 0) And (intN Mod 2 <> 0) Then
ReDim Preserve arrLin(intCount): arrLin(intCount) = Rhino.AddLine (arrPt(intM, intN), arrPt(intM+1, intN+1))
intCount = intCount + 1
End If
Next
Next
End Sub
Posted in Uncategorized | Leave a Comment »
1. page24_MyBogusFunction.rvb (Not originally I meant, since it is already marked as an error code in the tutorial)
2. Page63_DistributeCirclesOnSphere.rvb
The sample code will cause a Syntex error. To fix this, remove the next empty line after “_”.
3. page41_AddVectorExample.rvb
This sample code normaly works well. However when the Vector Field Base Point is one of the pointcloud, the sample code makes an error. To prevent this, just add one conditional (“if-then-end if” ) statement and check whether the vector base field point is not located on the point cloud.
Page114_TensorSpaceSmoothing.rvb
The name of the main sub and the function are identical (“SurfaceTensorField) which caused an error. Simply change one of these two into different name and match “Call” accordingly. I just changed the name of sub into main().
Before :
Call SurfaceTensorField()
Sub SurfaceTensorField()
……
Function SurfaceTensorField(ByVal idSrf, ByVal Nu, ByVal Nv, ByRef T, ByRef K)
……
After:
Call main()
Sub main()
……
End Sub
Function SurfaceTensorField(ByVal idSrf, ByVal Nu, ByVal Nv, ByRef T, ByRef K)
……
End Function
Good Job for everybody
Thanks
Juhong
Posted in Uncategorized | Leave a Comment »
You have become somewhat familiar with debugging and adjusting code from 101, and have developed a pseudo-code for your projects. For tomorrow, take your pseudocode into Monkey or another script editor, and using them as comments, try to convert them into code. Get as far as you can. Identify and place whichever rhino commands are needed (ie rhino.addline), and in necessary sequence (which is why we asked that you also make a 3d file; to help develop the procedures).
Tomorrow we’ll start again with a group discussion, choose 2 pseudocodes to develop as a group and finish with the panel exercise (laying out for fabrication).
Posted in Uncategorized | Leave a Comment »
The scripts which didn’t work was:
page 24 (My bogus Function) which I changed it alittle bit:
Option Explicit
Call main()
Sub Main()
Dim blnResult
Dim a,b
a=rhino.getinteger(“a”)
b=rhino.getinteger(“b”)
Call MyBogusFunction(a,b)
End Sub
Function MyBogusFunction(ByRef intNumber1,ByRef intNumber2)
intNumber1 = intNumber1 + 100
intNumber2 = intNumber2 * 2
If intNumber1 > intNumber2 Then
‘convert intNumer into string
CStr(intNumber1)
CStr(intNumber2)
MyBogusFunction=rhino.Print(intNumber1 & ” is bigger than the ” & intNumber2)
Else
MyBogusFunction=rhino.Print(intNumber2 & ” is bigger than the ” & intNumber1)
End If
End Function
I also played with the text and time and dimension:

Option Explicit
‘Display an updating digital clock in and the location in the 3d Matrix + the lines that connect the points together
Call ViewportClock()
Sub ViewportClock()
Dim strTextObjectID
Dim x,y,z
For x=0 To 5
For y=0 To 5
For z=0 To 5
rhino.addpoint array(x,y,z)
rhino.addpolyline(array(array(x,y,z),array(x,y,z+1)))
rhino.addpolyline(array(array(x,y,z),array(x+1,y,z)))
rhino.addpolyline(array(array(x,y,z),array(x,y+1,z)))
strTextObjectID = Rhino.AddText(“(“&x&”,”& y &”,”&z&”)”& CStr(time()), Array(x,y,z),0.05)
Next
Next
Next
Dim i,j,k
If IsNull(strTextObjectID) Then Exit Sub
End Sub
Posted in Uncategorized | Leave a Comment »
I was looking at the book ” the Computational Beauty by nature ” and I saw the Lorenz Attractor Function. The Lorenz attractor, named for Edward N. Lorenz, is a 3-dimensional structure corresponding to the long-term behavior of a chaotic flow, noted for its lemniscate shape. The map shows how the state of a dynamical system (the three variables of a three-dimensional system) evolves over time in a complex, non-repeating pattern.

this is a three dimensional Picture and you might need to put on your anaglyph glasses to see it as it is in space.
you can also find the script in Marc Fornez’s blog, Feb 23, 2006. I changed it a little and here is the result with the vector presenting the directions of the flow.
Option Explicit
Call Lorenz attractor()
Sub Lorenz attractor()
Dim x,y,z
Dim arrpt2
x=1: y=1: z=1
Dim arrpt1: arrpt1=array(x,y,z)
Dim min: min=1
Dim max: max=200000
Dim h : h=0.01
Do While (min<=max)
x=x+h*dx(x,y,z)
y=y+h*dy(x,y,z)
z=z+h*dz(x,y,z)
arrpt2=array(x,y,z)
‘Dim ptstr: ptstr=Rhino.AddPoint(arrpt2)
‘Call rhino.ObjectColor(ptstr,ParamColor(x))
Dim vecdir: vecdir=rhino.vectorcreate(arrpt1, arrpt2)
Dim arrow: arrow= rhino.curvearrows(rhino.addline(arrpt1,arrpt2),2)
arrpt1=arrpt2
min=min+1
Loop
‘Call Rhino.EnableRedraw(True)
End Sub
Function dx(x,y,z)
‘rho = 28; sigma = 10; beta = 8/3
dx= 10*(y – x)
End Function
Function dy(x,y,z)
‘rho = 28; sigma = 10; beta = 8/3
dy= x*(28 – z) – y
End Function
Function dz(x,y,z)
‘rho = 28; sigma = 10; beta = 8/3
dz= x*y – 8/3*z
End Function
Posted in Uncategorized | Leave a Comment »


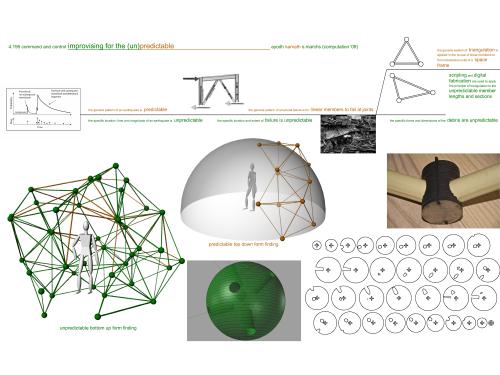
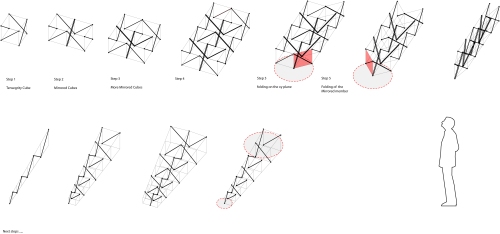
Below is pseudo code and screen shots of the corresponding hand modelling for making an irregular geodesic dome based on lengths of bamboo. There is a function for actually creating the fabrication files for the joints that I’ve not been able to do yet, but it similar to a script I was working on earlier, so I’m confident that I will be able to code it.
Main
-
Define arrAllPts
-
Define arrPerimeterPts
-
Get sphereRadius and draw strSphere
4. Get sides of triangle.
5. Draw triangle.
6. Draw circum-circle of triangle.
7. Move circle and triangle to centre of sphere using circle centre as base point.
8. Draw vertical line from circle to sphere.
9. Move triangle to the top of the vertical line using the bottom of the line as base point.
10. Store the coordinates of the triangle vertex (vPt1, vPt2 and vPt3) in an array, arrAllPts

-
Repeat until length of arrPerimeterPts = 3
-
Call function PerimeterPts to get values of arrPerimeterPts from arrAllPts
-
If a point vPt(x) is a part of arrAllPts and not a part of arrPerimeterPts then call function CreateJoint
-
End Repeat
Function PerimeterPoints
-
arrPerimeterPoints = arrAllPts
-
Loop i through all points in arrPerimeterPts –
-
Draw a line connecting the point to the apex of strSphere.
-
For all points on the same side of the line as point arrPerimeterPts(i+1) connect them with a line to arrPerimeterPts(i).
-
Of these lines find the one with a mid point fartherest from the apex of strSphere
-
If there are any points in arrPerimeterPts between this point and arrPerimeterPts(i), then remove the intermediate points from the array and draw a line between these two points, else, draw a triangle using these two points as the endpoints of one side using Function1 (also, align the triangle to strSphere using Function3) and insert the resulting third vertex of the triangle between these two points in arrPeremiterPts and arrAllpts.
-
Next i
Function 1
-
Select endPoint1 and endPoint2 of the existing line.
-
Get point1 to define the orientation of the triangle
-
Get sideLength1 and sideLength2.
-
Draw a circle circ1 with centre at endPoint1 and radius of sideLength1.
-
Draw a circle circ2 with centre at endPoint2 and radius of sideLength2.
-
Find the intersection points intPt1 and intPt2 of circ1 and circ2.
-
Find the distance between intPt1 and point1 and the distance between intPt2 and point1.
-
If intPt1 is closer to point1 then endPoint3 = intPt1, else, endPoint3 = intPt2.
-
Draw and return lines connecting endPoint1 to endPoint2, endPoint2 to endPoint3, and endPoint3 to endPoint1.
Function3
-
Select endPtOnSrf1, endPtOnSrf2, and endFree of the triangle.
-
Select the sphere1 on which endPtOnSrf1 and endPtOnSrf2 lie, and select the apexPt of spher1.
-
Draw a line1 from endPtOnSrf1 and endPtOnSrf2.
-
Draw a linePerp with start point at endFree and perpendicular to line1.
-
Draw intPt at the intersection linePerp and line1.
-
Draw circle on the plane perpendicular to line1 with centre at intPt and radius equal to linePerp.
-
Trim circle using sphere1 as a cutting object to get arc1.
-
Compare the distance of the two end points of arc1 to apexPt. endPtOnSrf3 = the end point with greater distance to apexPt.
-
Draw and return lines connecting endPtOnSrf1 to endPtOnSrf2, endPtOnSrf2 to endPtOnSrf3, and endPtOnSrf3 to endPtOnSrf1.

Posted in Uncategorized | Leave a Comment »
Hmph… I’m stuck. I started by looking at Skylar’s “Transient States” project (thanks!) because it seemed to demonstrate a clear way of organizing and scripting data that changes over time according to distance relationships among points. Here’s my first attempt, which is VERY ROUGH. I’ve added notes after each step to try and explain my intention and confusion.
__Create a base model of points distributed within a given field representing the world map. Each point represents a known living language (6,912) and is grouped according to region. *I’m not sure if this is the correct way to begin my point organization since physical proximity to other regions is less significant than the import of information via internet and goods. Also, 6,912 is a LOT of points. Do I simplify by grouping similar dialects?
_Assign values to each group, which reference the value of GDP products exported from that region. Values will be based on a scale from 1 to 180, referencing the World Bank’s ranking of GDP. *I’m making the assumption that the greater the GDP of a region, the more resilient it’s languages are against extinction.
_Within each group, assign secondary values, which will reference the number of speakers of that particular language. This will be a variable that will increase and decrease according to extinction patterns. *If I’m assigning two values to a particular point, will this become the U and V axis? GDP scale and Number of speakers?
_Create a loop function where every ‘two weeks’ the point containing the smallest speaker value is deleted and the number of speakers of that deleted point is added to the point containing the largest speaker value. *I’m not sure how to structure this loop because the ‘two week’ timing would actually decrease as the most popular language increases. Would I add a radical value to the loop timing so that it’s increasing by a factor of itself? Also, the GDP value should be incorporated since areas with smaller output are more vulnerable to extinction, despite the smaller number of speakers. Do I structure the loop by deleting the point containing the smallest value of the sum of GDP value and number of speakers?
_Establish a polyline through each point within individual groups. *I’m hoping that this will cause the more popular language groups to grow more complex while simplifying the shapes of those closer to extinction. I’m assuming time is the 3rd dimension of this form so it is always growing upward and gaining in momentum.
_Continue Loop until only one group remains.
Is there a way to capture the form along several states so that I could present the ever-changing form as a series of ‘time stamps’?
Posted in Uncategorized | Leave a Comment »
Ok… not actually a pseudo-code yet, but instead a description of where I’m headed. I’m still sorting through precedents trying to find a framework from which to start. I’ve tried to isolate the variables I’m interested in contrasting and focus the intention of the script as a way of controlling it. Hopefully, I’ll have some mock-ups and rough code to post later this afternoon.
The 6th Extinction: Knowledge via Language
I’ve narrowed my crisis to the extinction of language (and therefore knowledge). My first thought was to develop a script that would demonstrate the deterioration of languages over time. If a language disappears every two weeks and we currently have 6,912 living languages documented, when will the homogenization of culture finalize? This would be particularly interesting considering the fact that extinctions themselves quickly become the drivers of the process creating a dense network of positive feedback loops. The variables of this script would be time, language identifier, and number of living speakers of the language. The smaller the number of speakers, the quicker it approaches extinction. Once the language reaches extinction, those speakers are connected to a new language making it ever more popular and a greater threat to the next less-spoken language.
Another approach I’m considering involves a more “architectural” solution… although still very conceptual. The primary cause of language extinction is “the transnational flow of people & products, media & information, crops & commodities” (In Defense of Difference, SeedMagazine.com). The exposure and isolation of a community determines its vulnerability, but also its global influence. What kind of architectural intervention could control the flow of information? Perhaps a flexible skin could be stretched over the community and be made to constantly adapt according to the necessity of input and output? The script would function on conditionals such as, ‘What is the origin of the incoming information?’ and ‘To what degree is it relevant to this community’. The script would subsequently deny (or even translate) all undesirable influences. The scripted skin would allow for an ephemeral boundary constantly in flux. An important aspect of this script would be the variable of distance. Despite varying dialects, languages thrive on diversity within large communities. The skin would need to allow incoming information from neighboring communities, but deny those from foreign lands. The script would most likely take the form of a field condition with points shifting and even disappearing to alter density and transparency.
I’m going to start with the first approach since I have a better idea of how to structure the code. The second one still interests me so if there are any suggestions of scripted precedents to research, send them my way please.
Posted in Uncategorized | Leave a Comment »
The “TensorSpaceSmoothing” script seems to operate normally once the Call and Sub lines are changed to any other value. For example, by changing the text to read “Main” as we have done previously (or even any other alteration besides the given “SurfaceTensorField,” such as “SurfaceTensorField1”) seems to allow the script to run normally. I am not sure why the name “SurfaceTensorField” creates problems for the script.

Posted in Uncategorized | Leave a Comment »
I changed the variables within the codes to create new forms. No drastic changes, but still an interesting exercise in understanding the language structure. I came across four codes that didn’t work. The only one I was able to debug was “DistributedCirclesOnSphere” seen in the bottom left. The others didn’t return any visuals, but also didn’t show an error. I think this was because they had boolean data and my surfaces didn’t fulfill the requirements of the request so it didn’t return anything new. I tried a few different surface arrangements but with no luck. The unsuccessful codes were “CreateCurvatureGraph”, “SurfaceFitter”, and “TensorSpaceSmoothing”. Suggestions?
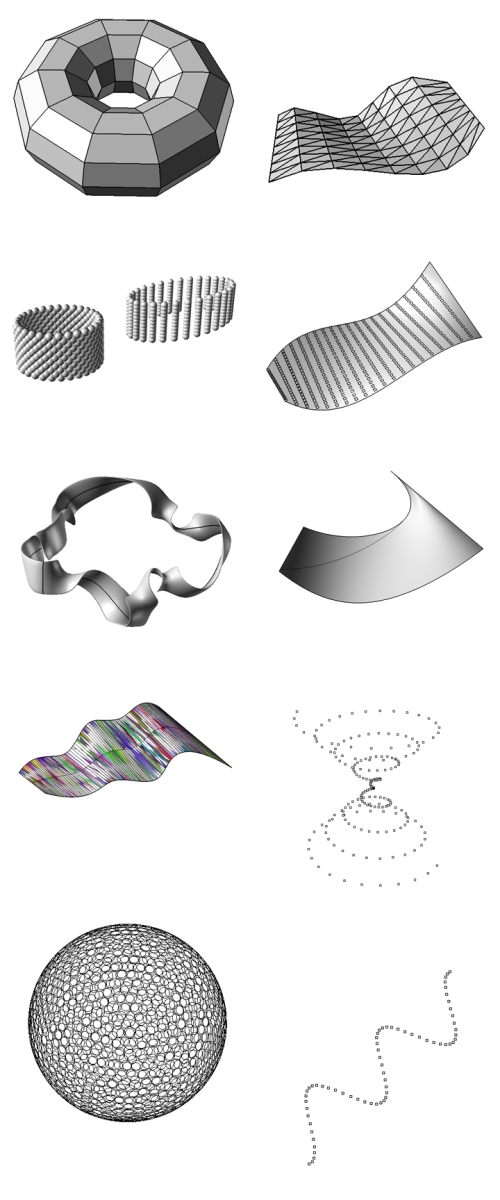
Pseudo-code of chosen crisis still to come…
Posted in Uncategorized | Leave a Comment »

For those of you who may want to focus on data visualization, I recommend to check this book.
If anyone interested in this book, please contact to me.
Thanks
Juhong (juhong@mit.edu)
Posted in Uncategorized | Leave a Comment »
Before starting the pseudo code I sat down in VUE and organized my thoughts.
Here’s the resulting diagram (larger original):

VUE diagram
Here’s the pseudo code that developed from that:
CODE LOGIC:
Establish environmental conditions
+ Draw/select AREA
+ Draw/select objects (BUILDINGS) within AREA – defines ‘interior’ space
+ Randomly populate AREA with a select number of points (PLAGUE)
+ Randomly populate AREA with a select number of points (MATES)
+ Locate architectural object (AO) within AREA
+ Evaluate PLAGUE proximities (loop)
– Draw line from AO to PLAGUE (PPATH)
– If PPATH intersects BUILDINGS, ignore PLAGUE
– If PPATH doesn’t intersect BUILDINGS, measure PPATH
– Find average PPATH distance and store (PD)
+ Evaluate MATE proximities (loop)
– Draw line from AO to MATE (MPATH)
– If MPATH intersects BUILDINGS, ignore MATE
– If MPATH doesn’t intersect BUILDINGS, measure MPATH
– Find smallest MPATH distance and store (MD)
Establish system condition
+ PD and MD change phsyicality of AO system
+ Possiblities
– PD and MD change seperate components on AO
– if PD < MD then AO turns ‘defensive’
– if PD > MD then AO turns ‘sexy’
Posted in Uncategorized | Leave a Comment »
All decipher/debug was done directly in the .rvb files.
Posted in Uncategorized | Leave a Comment »
For Thursday Jan 15
Part 1
Run and decipher 10 codes selected from the provided examples given from the 101 download, and find three that don’t work. Try to debug them.
Part 2
Adapt the scripts developed yesterday and today. Explore the differences in the parameters to become familiar with their internal logic
(ie make triangular panels, octagonal, circular etc).
Relate these scripts to your individual projects:
1. loops – take a component* of your system and generate many that have successive changes to that component. ie for this many times, do something
2. conditions – make a criteria that selects one outcome over another based on an evaluation. ie if this happens, then something else happens
Part 3
Develop pseudo-codes that exhibit what you would like to produce. This can be beyond what you have learned today but will contain loops and conditions.
Make this pseudo-code understandable to you by manually modeling it in rhino so that you know want to do by steps in code afterwards. By designing your project in 3d, the tangible stages of your pseudocode will be made clearer.
*your components are pieces of your system that embodies what you found critical in response to the disaster of your choice. This could be a pre-material unit of measure such as light, distance, or it can be architecturally tectonic such as a panel, truss.
***Please post all results on the class blog by thursday at noon and we will respond for friday’s assignment!
Posted in Uncategorized | Leave a Comment »
Location level specifics::


From location to source::

From source to seismotectonics::


Rate the quake::

Quantify energy::
How much stronger is an 8.7 earthquake than a 5.8?
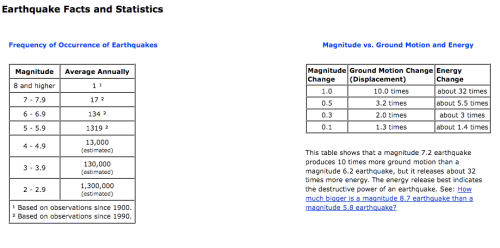

seismograms are plots of displacement versus time, of which the second derivative is the acceleration
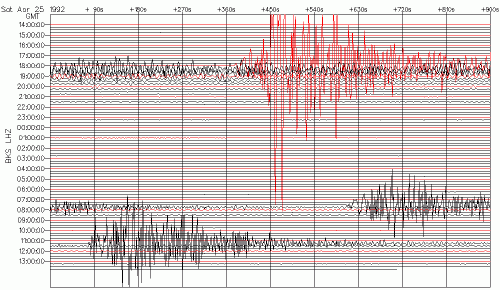

The consequence of energy and ground motion::


Statistics behind damping systems::
typical codes require 5% damping

Tectonics and plates::

Earthquake attributes::
seismic graph time vs. displacement
scales of earthquake
scales as translations of quantifiable energy /ground motion
frequency of rating/scale number
frequency of event in particular zone
location by global coordinates
fault line zones
5% damping needed
absorbed energy of structures
population displaced
relation of major cities and earthquake zones– migration
‘ring of fire’
Domain/site::
southeast asia? fault line zone
uneven terrain
solid ground– presents an issue of little existing damping action of ground to ground motion
Architectural response::
damping by materials
ductility– minimize brittle failure of materials, allow yielding
appendages for protection– allow mobility, consequential stability
isolation of safety chambers/spaces– pod or small shelter-like house
create architecture that responds to structural needs through material and geometry choices, derived from the data collected on resulting energy of such tectonic ground motion
Architectural directions::
literal


pure isolation


concept idea

Posted in Uncategorized | Leave a Comment »
Crisis: pandemic – bubonic plague
Location: Los Angeles, CA
Pathologist have increasingly commented that civilization is due for another pandemic akin to the Antonine Plague (165-180 AD) and Black Plague (multiple pandemics from 1300’s-1700’s AD). The form this pandemic will take is unknown and range in possibilities from the Ebola virus to SARS. Using the bubonic plague as placeholder, the project will address the means for the individual to survive in the harsh environment.
Dense urban environments are the most difficult to survive in during pandemics due to the higher risk of contact with a carrier and are typically the epicenters of infection. Based solely on this criteria there is no single location in the United States (see US Population Centers, below) that stands as an ideal worst-case context.
However, a key part of survival for the human species during a long-term catastrophic pandemic is reproduction. According to the 2006 American Community Survey by the US Census Bureau (Singles Distribution, below) most urban areas do not have an even distribution of single men to single women. For arguments sake one can arrive at the conclusion that a higher distribution of single women could result in higher regional birthrates and that a higher distribution of single men would mean the opposite. If one were to overlay population density with singles distribution, the high density/high single-men-distribution of the greater Los Angeles area frames that area as the ideal worst-case context for survival.
Precedent: Plague doctor
During the time of the Black Plague the character of the plague doctor came into being. Essentially a mercenary paramedic, they visited individuals to primarily evaluate if they were infected and perhaps administer the alchemy-based medicine of the time. These practices are reflected in their attire (see Plague Doctor, below), an early hazmat suit that coupled ‘mystical’ defenses with rudimentary practical protection.
Objectives:
– maintain separation of infected and non-infected (as enabler of non-infected)
– act as quarantine of infected (as confinement of infected)
– enable mating rituals (akin to Birds of Paradise?)
Possible architectural responses:
– environmental suit
– mobile ‘unit’ for individual
– intervention object: ‘hot-rod’ existing architectural elements


Posted in Uncategorized | Leave a Comment »
Rates of Extinction:
Every two weeks – an entire human language
Every six hours – a domesticated food-crop variety
Every few minutes – an entire species
Rates of Consumption:
Since 1900, the human population has increased by a factor of four, water use by a factor of nine,
carbon dioxide emissions by 17, marine-fish catch by 35, and industrial output by 40.
Cause and Effect:
The difficulty of this crisis is the way in which cause and effect lines run in many directions.
Extinctions themselves quickly become the drivers, creating a “dense network of positive
feedback loops.”
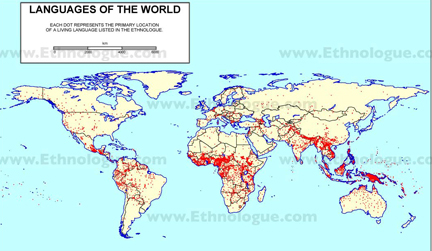


The primary reason for maintaining diversity is RESILIENCE.
Architectural Response:
Understanding and articulating the variety of human-environment relationships is the primary goal of this architectural response. The strategy will involve documenting, describing, and understanding how people perceive, use, and manage their environments. The architectural intervention must be a dynamic space where human behavior shapes nature and nature shapes human behavior. The relatedness of natural and artificial could be explored through use of materials. Location is central to the problem therefore the architecture must directly reference its place through assembly, material, and usage.
Posted in Uncategorized | Leave a Comment »

The diagram shows how the process of disaster affects the society by different causes and situations. We can understand it by borrowing analogy from the disasters itself, in this case: how Tsunami affects people from the very beginning of the epicenter caused by a landslide deep in the ocean, to the very end after they hit shore and human settlement.
The epicenter can be a natural design or a man-made design. Whatever the causes are, the disaster will first be noticed by how it changes physical aspect of human life, either to the surrounding nature or to the habitat itself. The physical changes of design in this entity (man-made/nature entity) will gradually affect the people begins to our emotion and later our intellectual capability, where the real catastrophe lies….
Objective [my utopia]:
– Define Types of Causes and Effects (Nature / Man-Made) as Variables.
– Analyze how they interact each other.
– Define parametric designs based on those variables as well as other constrains (local material, skills, technology, etc…)
Posted in Uncategorized | Leave a Comment »
Posted in Uncategorized | Leave a Comment »


The devastation wrought by Katrina in 2005 demonstrates the impact of one of natures greatest disasters upon the built environment. Utilizing statistics such as landfall latitude and longitude combined with Hurricane wind speed and pressure, as well as the potential to include figures such as death rates and property damage, I want to utilize Rhinoscripting to manifest hurricane shelter units. Aerodynamically sensitive pods for stranded families that could be clustered into communities would provide new sensibility to those affected by these storms. Given the horrific winds reaching above 150 mph, aerodynamics are critically important

Given the horrific winds reaching above 150 mph, aerodynamics are critically important for structures in the path of a hurricane. Structures built to withstand these conditions have adopted a dome shape and generally are built subsurface. A new identity for such structures will need to reexamine the ground plane and will need to respond to the potential for flooding and rising sea levels.
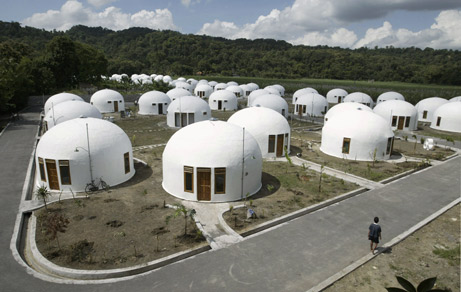

Posted in Uncategorized | Leave a Comment »
Posted in Uncategorized | Leave a Comment »
Posted in Uncategorized | 1 Comment »
For tomorrow please prepare and upload a table, catalogue, map or diagrams that specifies which disaster you choose, and its particular domain of attributes. Then speculate what design strategies or architectural responses would be related to this particularity as a domain or site. This will be the beginning of your design enquiry; the more your speculation contains in relationships, analysis and criteria, the more critical we can be in the direction of the work. Have this ready for tomorrow as we will begin with a group discussion.
Posted in Uncategorized | Leave a Comment »
abstract How many studios are sufficient in the training of an architect – the average number of projects a six-semester graduate student will design is about twelve. The studio projects encountered will have differences in program, context, scale, abstraction but what will be the degrees of difference in rigour or methodology?
This IAP course will be a 2 week studio project that will utilize Rhino and visual basic for Rhino. Like any tool, it is the application to which a tool is deployed that measures its efficacy. The pen-ness of an utensil has a direct mapping to the draughted-ness of its expression. This state-specificity does not remove the ligature nor the foreknown rules of the composition. Exercise and practice is required to gain ability and then demonstrate artistry. The scripting environment of Rhino is also a tool environment and is therefore also valid for architectural enquiry.
This course will be different from rhinoscript workshops as it will not be a supplement or enabler for studio but will be in the form of a studio where students will be working on a design project, with a grade and credits.
Studio Brief:
Design an emergency architecture for crisis times. If pavilions are architectural typologies for the predictable or the leisurely, the architectural inversion would address the unexpected and the immediate. This connotes a certain temporality – speed of deployment, indeterminate staging, mobility – as well as spatial requirements of envelope, material, scale.
The site is one of crisis – recent events are an excellent source, with their domain of criteria. For example, property destruction by weather or attack certainly has issues identified above, but what of financial market destruction? Data drawn from crashing stock points is data to be manipulated like any other, and available for spatial-temporal investigation.
The control of this data from crisis and its negotiation of responsive form, and its making from the digital to the fabricated is the core of this project.
Deliverables
physical: scaled prototype with configuration systems, logic of assembly, component schedule
drawings: plans, section, data relationships/diagrams
Posted in Uncategorized | Leave a Comment »
